Hi all!
I have an issue when combining a bunch of plots onto one TCanvas. Basically, I have a few macros that each generate a plot, with heavily altered axis labels (e.g. removing first/last tick, changing numbers to pi etc).
I have another macro that takes all these plots, and draws them into one TCanvas on different TPads, in a specific “formation”. I plot them on different TPads with DwarClonePad(), but it seems to remove the nice axis formatting…
void plotter(){
// Example plot - in reality I have 10 different macros that
// make plots which I then need to combine into one
TCanvas *c = new TCanvas("c", "c", 400, 400);
Double_t pi = TMath::Pi();
TF1* f = new TF1("f","TMath::Cos(x/TMath::Pi())", -pi, pi);
TH1* h = f->GetHistogram();
TAxis* a = h->GetXaxis();
a->SetNdivisions(-502);
// Some axis customization
a->ChangeLabel(1,-1,-1,-1,-1,-1,"-#pi");
a->ChangeLabel(-1,-1,-1,-1,-1,-1,"#pi");
f->Draw();
// This is what I want the example axis to look like
c->SaveAs("correct_axis.pdf");
// Big multi-plot canvas - this is where I will combine all the
// plots together. In this example I'm plotting one TCanvas
// twice, in my big macro I'm loading 10 files with a TCanvas each
TCanvas *big = new TCanvas("big", "big", 1000, 500);
// PAD 1
big->cd();
TPad *left = new TPad("left", "left", 0.1, 0.1, 0.5, 0.9);
left->Draw();
left->cd();
c->DrawClonePad();
// PAD 2
big->cd();
TPad *right= new TPad("right", "right", 0.5, 0.1, 0.9, 0.9);
right->Draw();
right->cd();
c->DrawClonePad();
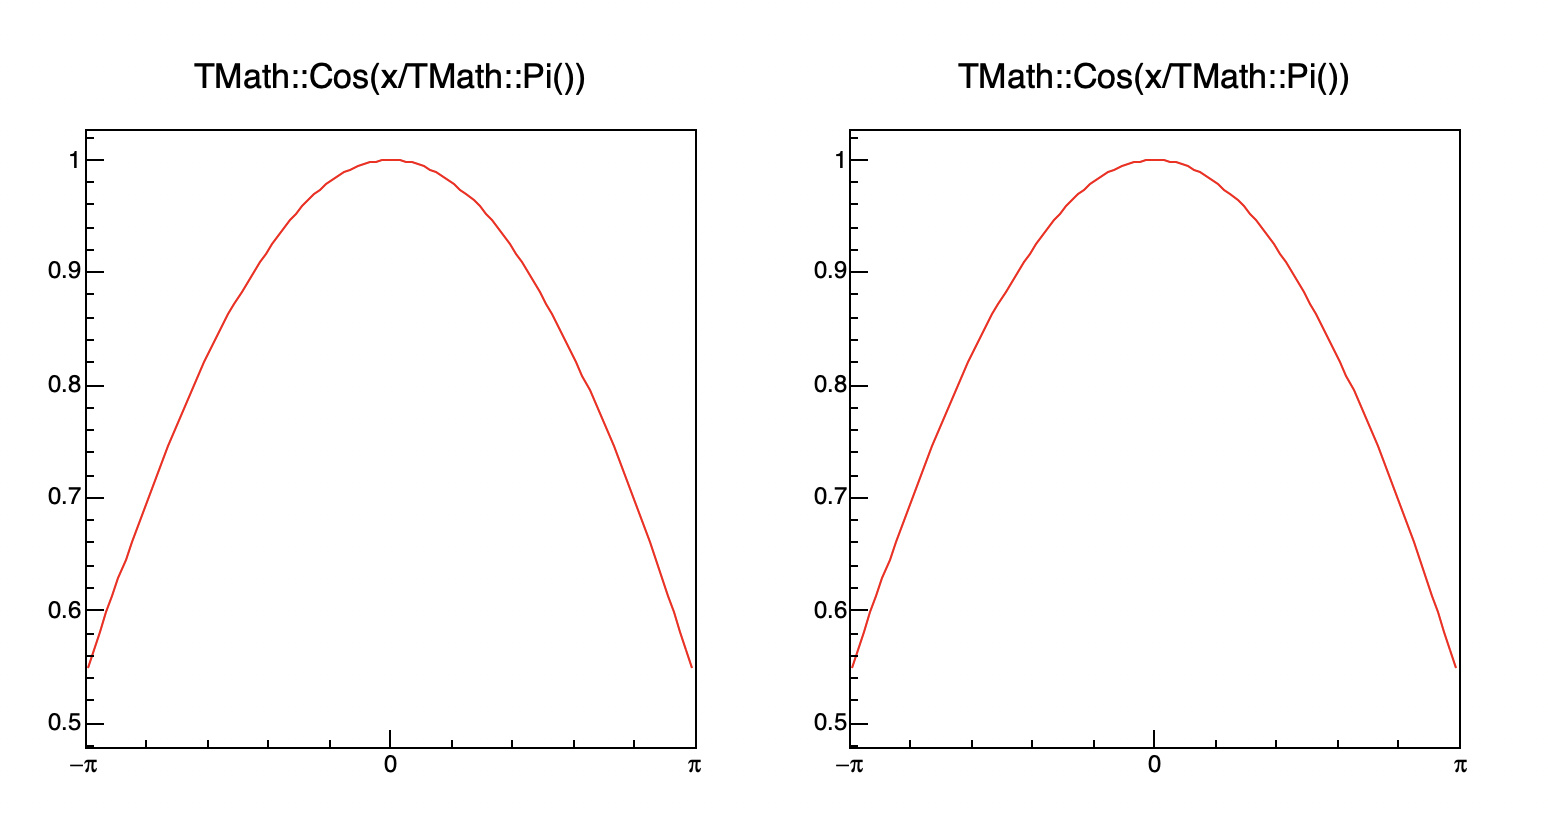
// The X axis in this plot is changed, and I need them to be
// the same as in correct_axis.pdf
big->SaveAs("bad_axis.pdf");
}
Does anyone know how to go around this?
ROOT Version: 6.18/04
Platform: Gentoo, kernel: 5.1.6
Compiler: gcc 9.1.0
Python: 3.6.5