Draw two TF1

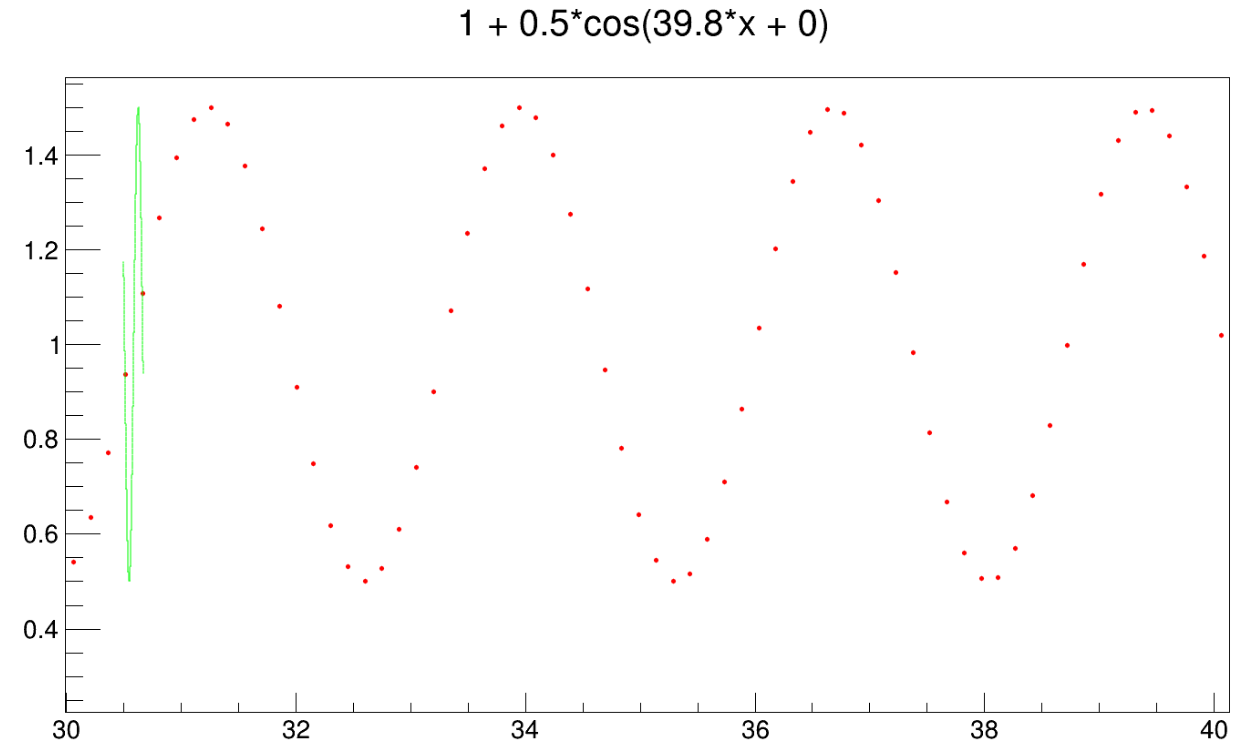
I have two TF1s (one is the modified version of the other), therefore they should be defined on the same x/y range. However, when I plotted them on the same axes (see the codes), I got something unexpected (picture). How to workaround this ?

npts = 4000
plot_range = (30,40)


gen_func = r.TF1("gen_func","1 + 0.5*cos(39.8*x + 0)",0,npts*0.1492); 
gen_func.SetNpx(npts*1) 
gen_func.GetXaxis().SetRangeUser(*plot_range)
# gen_func.SetLineColor(4)
gen_func.SetLineColorAlpha(4,0.2)
gen_func.SetMarkerStyle(20)
gen_func.SetMarkerSize(0.5)
gen_func.SetMarkerColor(2)

gen_func2 = gen_func.Clone("gen_func2")
gen_func2.SetNpx(npts*20) 
gen_func2.GetXaxis().SetRangeUser(*plot_range)
gen_func2.SetLineColorAlpha(3,0.3)

c = r.TCanvas("cc","c",1600,900)
# this doesnt work
# gen_func.Draw(" P")
# gen_func2.Draw("same L")

# this work, but not the one that i want
gen_func.Draw("P")
# gen_func2.Draw("L")

c.Draw()

_ROOT Version:_6.24 (conda-forge)
Platform: centos
Compiler: gcc9


@couet will take a look once back from vacation

Not sure why, but don’t do SetRangeUser on gen_func2:

#gen_func2.GetXaxis().SetRangeUser(*plot_range)

I don’t think PyROOT supports *plot_range. So just do:

gen_func.GetXaxis().SetRangeUser(plot_range[0], plot_range[1])

Lorenzo

i have been using it for several times and it seem works well …

Looking at it. It is weird.
You do not need a 2nd function to reproduce it. Just draw the same with option “L SAME”

void Ng() {
   auto gen_func = new TF1("gen_func","1 + 0.5*cos(39.8*x + 0)",0,10);
   gen_func->SetNpx(1000);
   gen_func->GetXaxis()->SetRangeUser(3,3.5);
   gen_func->SetLineColor(4);
   gen_func->SetMarkerStyle(20);
   gen_func->SetMarkerColor(2);
   gen_func->Draw(" p");
   gen_func->Draw("same L");
}

gives:

The 2nd drawing is partial.

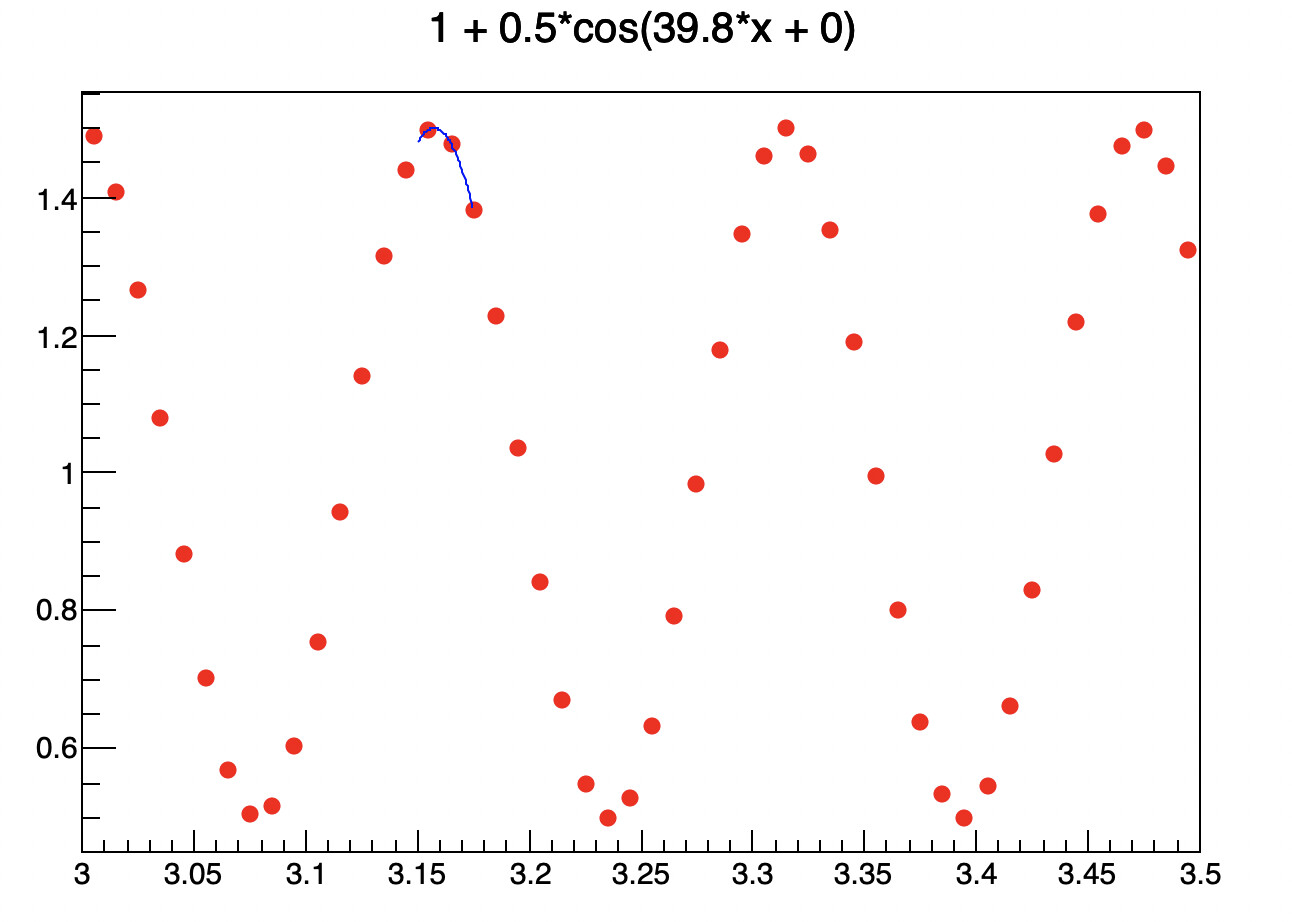
Yes, that’s the point, you should not impose the range on the second function as it is already set on the first one and you draw the 2nd with the option SAME. The range of the 1st function imposes itself on the 2nd.

void Ng() {
   auto f1 = new TF1("f1","1 + 0.5*cos(39.8*x + 0)",2.5,4);
   f1->SetNpx(1000);
   f1->GetHistogram()->GetXaxis()->SetRangeUser(3,3.5);
   f1->SetLineColor(4);
   f1->SetLineWidth(4);
   f1->SetMarkerStyle(20);
   f1->SetMarkerColor(2);

   auto f2 = new TF1("f2","1 + 0.5*cos(39.8*x + 0)",2.5,4);
   f2->SetNpx(1000);
//   f2->GetHistogram()->GetXaxis()->SetRangeUser(3,3.5); /// << do not set the range on the 2nd funtion
   f2->SetLineColor(4);
   f2->SetLineWidth(4);
   f2->SetMarkerStyle(20);
   f2->SetMarkerColor(2);

   auto c = new TCanvas();
   f1->Draw(" p");
   f2->Draw("same  L");
}

@couet Assume you have several functions coming from different macros, each of which has some range set. Now you say they cannot be drawn together on the same canvas.

One will need to unzoom them I guess.

Hi @couet,

The problem is not there is you use TF1::SetRange instead of TF1::GetHistogram()->GetXaxis()->SetRangeUser. So it is bug in the second case. Can you maybe open a GitHub issue?

Lorenzo

The problem can also be seen if you execute:

void Ng() {
   auto f1 = new TF1("f1","1 + 0.5*cos(39.8*x + 0)",2.5,4);
   f1->SetNpx(1000);
   f1->SetLineColor(4);
   f1->SetLineWidth(4);
   f1->SetMarkerStyle(20);
   f1->SetMarkerColor(2);

   auto c = new TCanvas();
   f1->Draw(" p");
   f1->Draw("same  L");
}

And then zoom interactively on the X axis.

@moneta , I made an issue.

PR here: Fix for TF1::SetRangerUser by couet · Pull Request #12694 · root-project/root · GitHub

PR Merged

This topic was automatically closed 14 days after the last reply. New replies are no longer allowed.