Hello,
I have a tree filled with names of nuclear isotopes, so string variables:
root [1] tree->Scan()
0 * B9 *
1 * Be8 *
2 * Be8 *
3 * Be8 *
4 * Be8 *
5 * Be8 *
6 * Be8 *
7 * Be8 *
8 * Be8 *
9 * Be8 *
10 * B9 *
11 * Be8 *
12 * B9 *
13 * Be8 *
14 * Be8 *
15 * Be8 *
16 * Be8 *
17 * Be8 *
18 * Be8 *
19 * Be7 *
20 * Be8 *
21 * Be8 *
22 * Be7 *
23 * Be8 *
24 * Be8 *
Type to continue or q to quit ==>
and I would like to draw a histogram with a BAR option, to see how many isotopes and what is the isotopes range I have.
However
tree->Draw(“iso”,“1>0”,“BAR”)
does not produce a bar histogram with all the isotopes names on the X axis.
I would be very grateful if you could please let me know how I could plot this.
Thank you,
Cristian
couet
February 3, 2014, 3:44pm
2
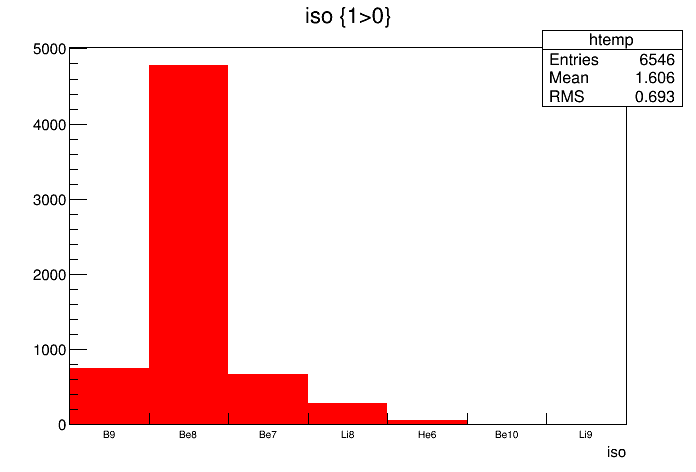
With option BAR the line border is not drawn. Simply do
tree->SetFillColor(kRed);
tree->Draw("iso","1>0","BAR")
Hello,
Thank you very much for your reply. I have tried this, however without success. I have attached the root file and I would be very grateful if you could please try these commands:
tree_Be->Scan() - this will show you the list of isotopes I want to plot
Please let me know any suggestions.
Thank you,
Best regards,
Cristianisotopes.root (30.7 KB)
couet
February 3, 2014, 4:30pm
4
What you suggested me to try :
root [0] TFile f("isotopes.root");
root [1] tree_Be->SetFillColor(kRed);
root [2] tree_Be->Draw("iso","1>0","BAR")
gives me the following output:
Which root version are you using ? on which machine ?
Thank you for looking into this. I am using root 5.33/03 on Ubuntu 12.04. I have attached my output following those three lines.
Shall I install a newer version of ROOT?
Thank you,
Cristian
couet
February 3, 2014, 4:50pm
6
try to start root with the option “-l”
root -l
Still the same. Shall I upgrade to 5.34.14?
couet
February 3, 2014, 5:00pm
8
In principal no … do you get something if you remove the option BAR ?
It’s exactly the same output. I have upgraded the operating system (kernel, ubuntu libraries, compiler maybe, etc) many times since I installed ROOT, so a new installation might solve this, I don’t know. I am trying a fresh install. If you do have any more ideas, please let me know.
Thank you,
Cristian
ksmith
February 3, 2014, 5:09pm
10
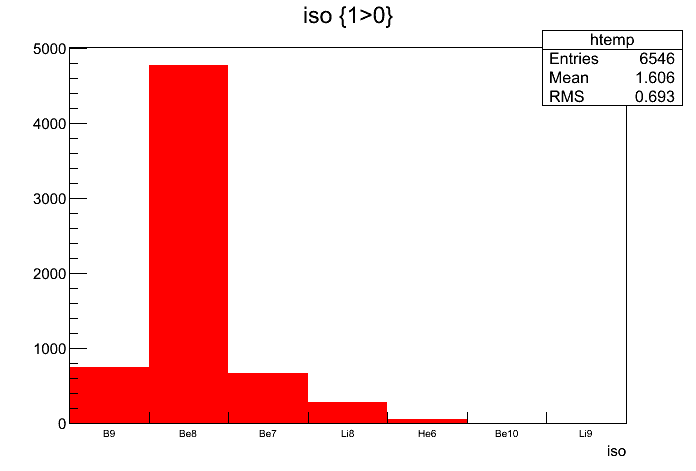
I can confirm that root 5.32 produces the expected red bar plot.
cbungau
February 3, 2014, 5:19pm
11
Hello again,
Just finished the installation of 5.34.14 and the plot looks as it should.
I have no idea
Thank you very much for all your suggestions. I didn’t know initially about having to set the fill colour.
Best regards,
Cristian
 why my previous installation of 5.33 didn’t work.