had a thread on ROOT Support, but bombard this disucssion forum also in hope of solving the problem.
How can I plot a THStack object with error bars with the error bars automatically fitting inside the canvas? It seems like ROOT does not calculate place to fit the error bars and they get cut off and not fully included in the plot.
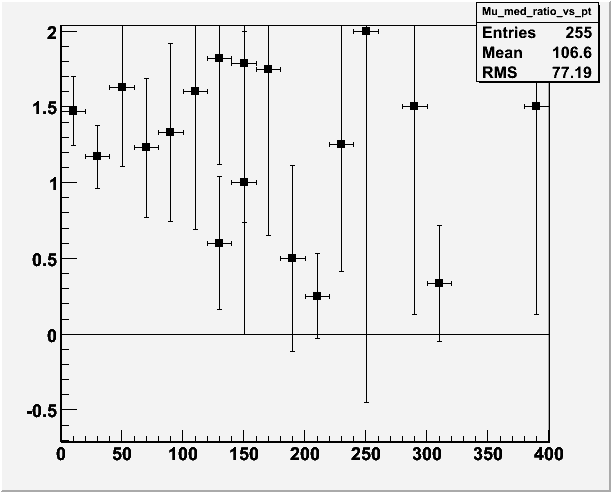
I attach a figure as example.
I have zoomed below zero so that you can clearly see the error bars that fall outside the actual plot window at negative values.
This will require a fix in the code which I do not have yet. If you want a fast solution without downloading a new root version, here is a quick workaround:
I have actually been trying to do this for 2 year (!!) now.
Point is that I am looping over many histograms, plotting them and saving them , and want to prevent having to set the ranges by hand for each plot, then I would have to check which of all histograms have the largest range etc, pick out this and set it by hand, which is quite cumbersome.
When do you think it can be included?
By the way, there is also a very strange feature with TGraphError and TMultiGraph. I was trying to see if using these objects would make things better. The problem there is that if I have empty points, they get accumulated automatically at x=0, y=0 . Do you know anything about this “feature”? I link you to the thread I had on support.
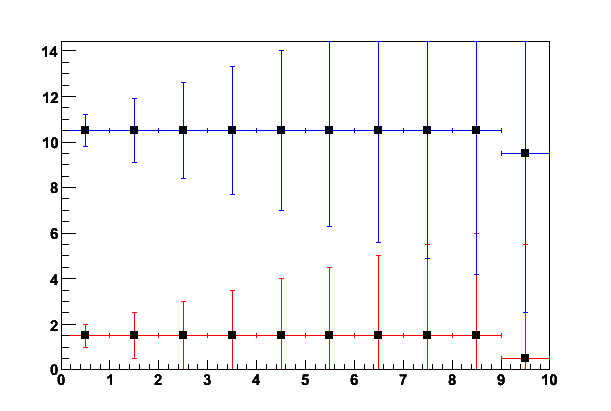
thanks for the implementation - there seems still to be one issue?
Looks like the canvas gets set correctly for the upper limit, but not for the lower limit? The error bars still fall outside the canvas for the minimum y-value.