Draw Square TH2

Relevant Information:
ROOT Version: 6.04.02
Platform: 3.16.0-4-amd64 GNU/Linux
Compiler: gcc version 4.9.2 (Debian 4.9.2-10+deb8u1)

I am trying to draw a square TH2 while creating room for the color bar. Here is a minimal example of my problem:

void minimal() {

  auto hist = new TH2F("hist","",2,0,2,2,0,2);

  hist->SetBinContent(1,1,1e3);
  hist->SetBinContent(1,2,1e4);
  hist->SetBinContent(2,1,1e5);
  hist->SetBinContent(2,2,1e6);

  auto canvas = new TCanvas("canvas","canvas",900,900);

  hist->SetStats(0);
  hist->Draw("colz");

}

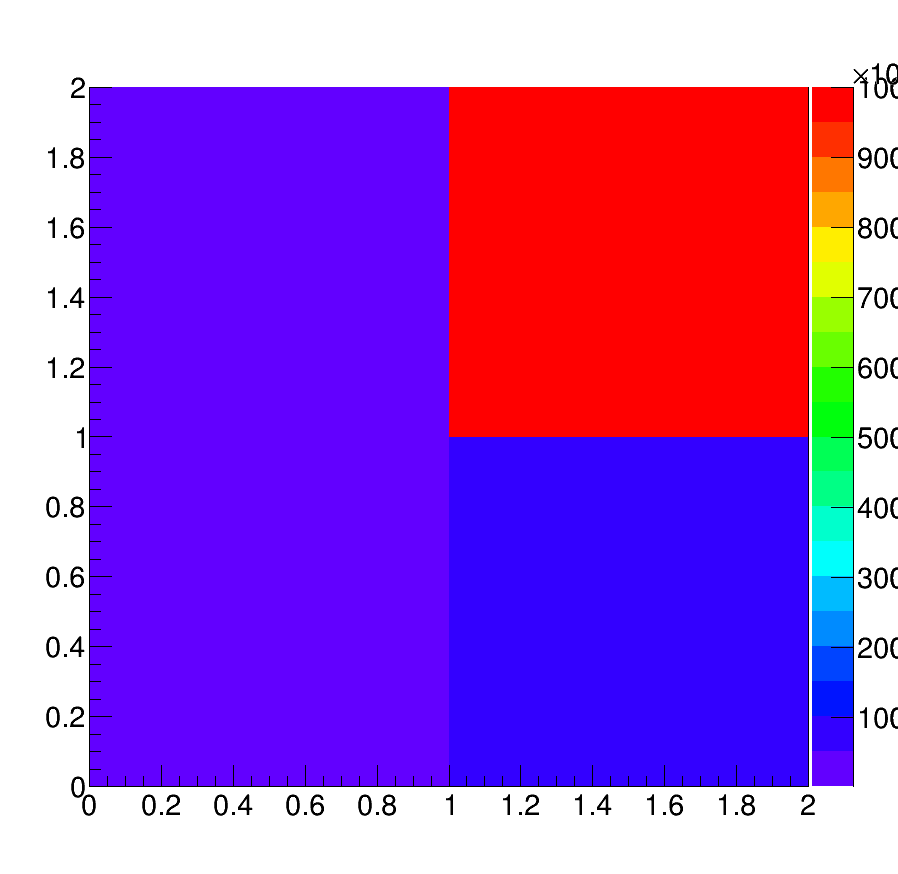
This produces a square TH2, but the tick labels for the color bar are cut off:

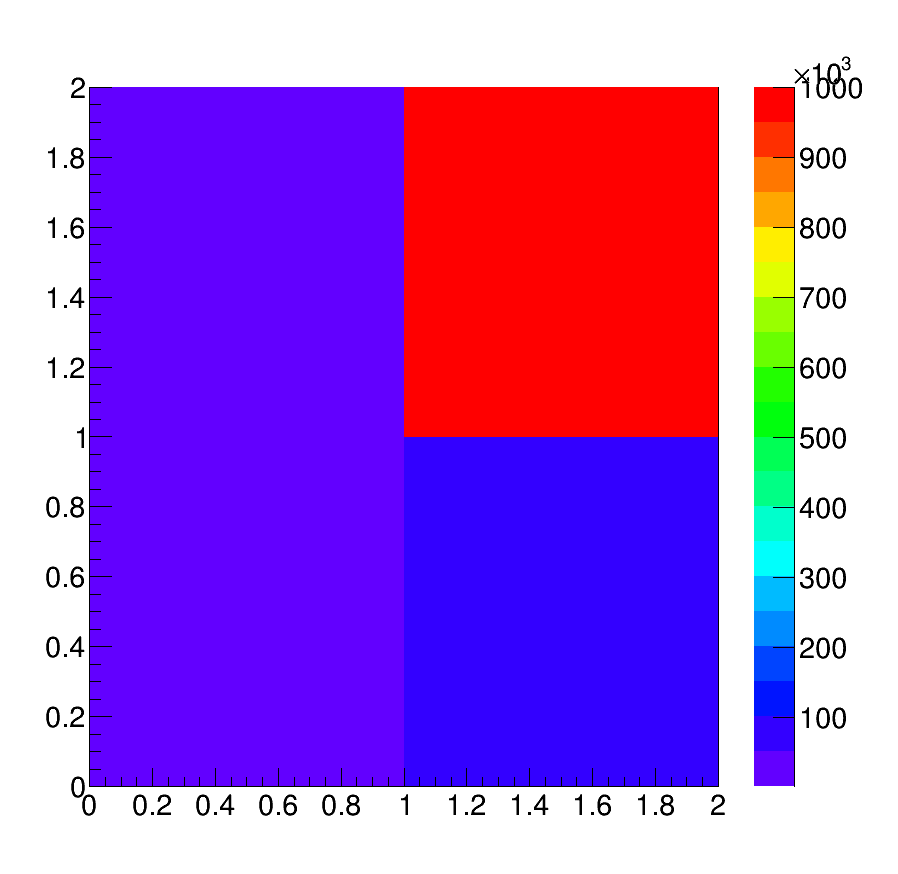
So I increased the size of the right margin in order to show all the tick labels. However, now the TH2 is no longer square:

void minimal() {

  auto hist = new TH2F("hist","",2,0,2,2,0,2);

  hist->SetBinContent(1,1,1e3);
  hist->SetBinContent(1,2,1e4);
  hist->SetBinContent(2,1,1e5);
  hist->SetBinContent(2,2,1e6);

  auto canvas = new TCanvas("canvas","canvas",900,900);
  canvas->SetRightMargin(0.2);
  //canvas->SetTopMargin(0.2); // this makes the TH2F be square at the expense of a waste of empty space at the top... I do not want this

  hist->SetStats(0);
  hist->Draw("colz");

  gPad->Update();
  TPaletteAxis* palette = (TPaletteAxis*) hist->FindObject("palette");
  palette->SetX1(palette->GetX1() + 0.1);
  palette->SetX2(palette->GetX2() + 0.1);
  gPad->Modified();

}

Which produces:

So how do I both: (1) increase the space so the tick labels of the color bar are displayed, and (2) still keep the TH2 as a square?
As you can see in the code above, I do not want to use TCanvas::SetTopMargin since this creates empty space at the top.

Modify the canvas size. Y size should be smaller

Hi couet,

Thanks for the reply. Is there a way to know/calculate how much to change the Y size based on the amount in TCanvas::SetRightMargin?

Hi couet,

Thanks for the reply. Is there a way to know/calculate how much to change the Y size based on the amount in TCanvas::SetRightMargin?

Try (it’s not exactly square, but close; maybe @couet can give some better approximation of “w”):

{
  Double_t r = 0.15; // right margin (default right margin = 0.1)
  Double_t w = 900 * (1.0 - 0.1 - 0.1) / (1.0 - 0.1 - r); // left margin = 0.1
  Double_t h = 900 * (0.1 + 0.8 + 0.1); // bottom and top margins = 0.1
  TCanvas *c = new TCanvas("canvas", "canvas", w, h);
#if 1 /* 0 or 1 */
  c->SetWindowSize(w + (w - c->GetWw()), h + (h - c->GetWh()));
#else /* 0 or 1 */
  c->SetCanvasSize(w, h);
#endif /* 0 or 1 */
  c->SetRightMargin(r);
  
  TH2F *hist = new TH2F("hist","",2,0,2,2,0,2);
  hist->SetStats(0);
  
  hist->SetBinContent(1,1,1e3);
  hist->SetBinContent(1,2,1e4);
  hist->SetBinContent(2,1,1e5);
  hist->SetBinContent(2,2,1e6);
  
  hist->Draw("colz");
}
// This function creates a canvas making sure the plot is square. 
// The first parameter w is the canvas width and l, r, b and t are the
// left, right, bottom and top magins. The canvas height is computed with these
// parameters in order to have a square plot.

void DefineSquarePLot (int w, float l, float r, float b, float t)

{
   int h = ((1.-(l+r))*w)/(1.-(b+t));
   auto C = new TCanvas("C","C",w,h);
   C->SetLeftMargin(l),
   C->SetRightMargin(r),
   C->SetBottomMargin(b),
   C->SetTopMargin(t);
   C->Draw();
}

void squareplot() {

  auto hist = new TH2F("hist","",2,0,2,2,0,2);

  hist->SetBinContent(1,1,123e3);
  hist->SetBinContent(1,2,123e4);
  hist->SetBinContent(2,1,123e5);
  hist->SetBinContent(2,2,123e6);

  DefineSquarePLot(800, 0.1,0.2,0.1,0.1);

  hist->SetStats(0);
  hist->Draw("colz");
}

See also https://root-forum.cern.ch/t/set-real-aspect-ratio-of-th2-or-tgraph/

This topic was automatically closed 14 days after the last reply. New replies are no longer allowed.