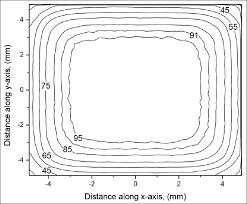
hi
TFile* f =new TFile("result.root");
TCanvas* c1 = new TCanvas("c1", " ");
TTree* tree = (TTree*)f->Get("Ntuple1");
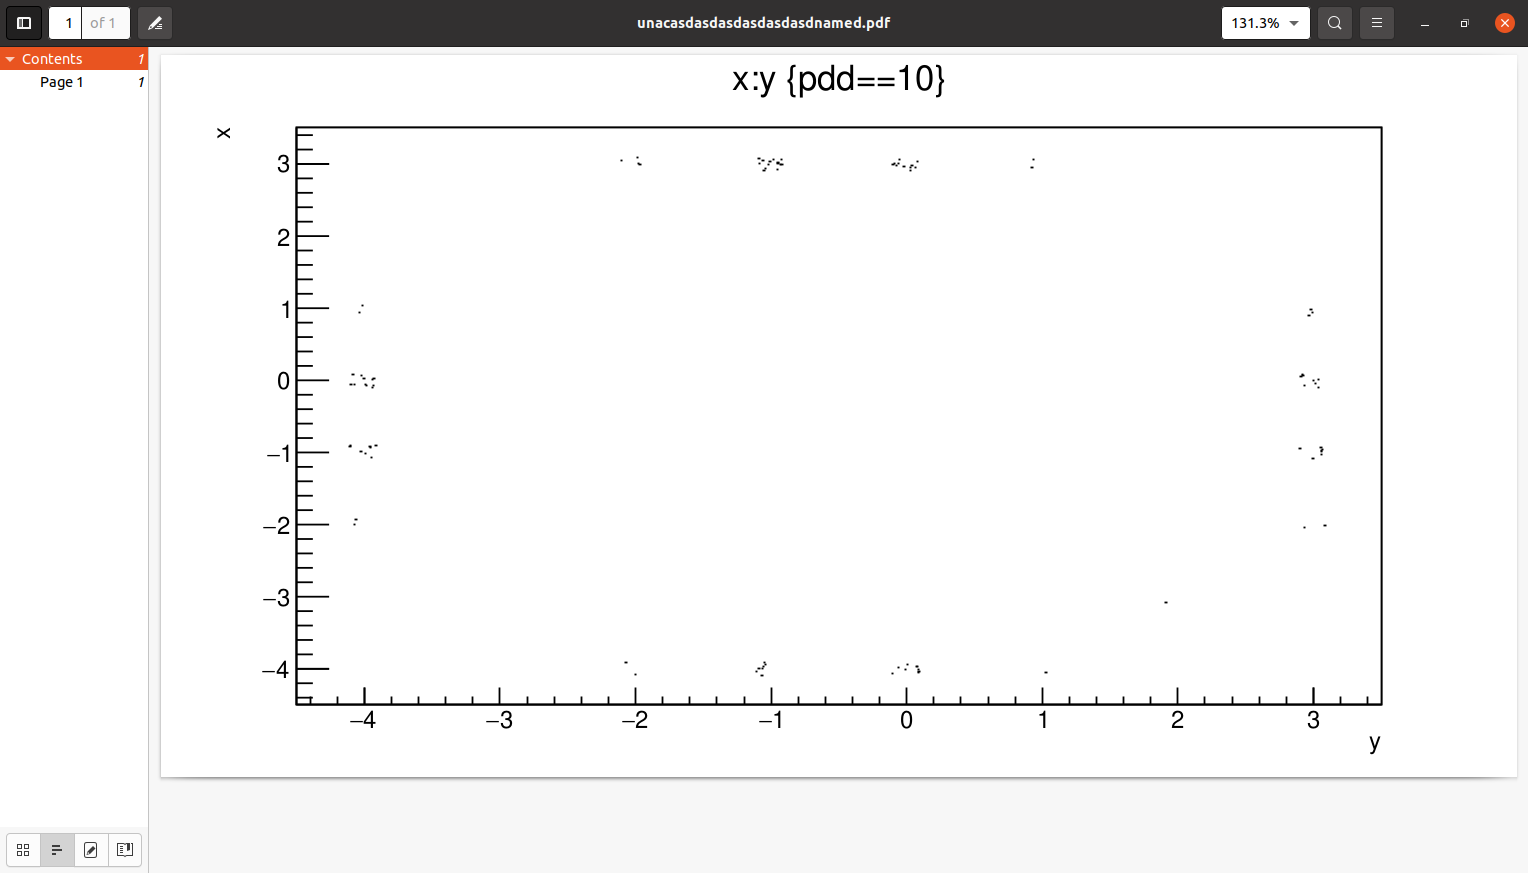
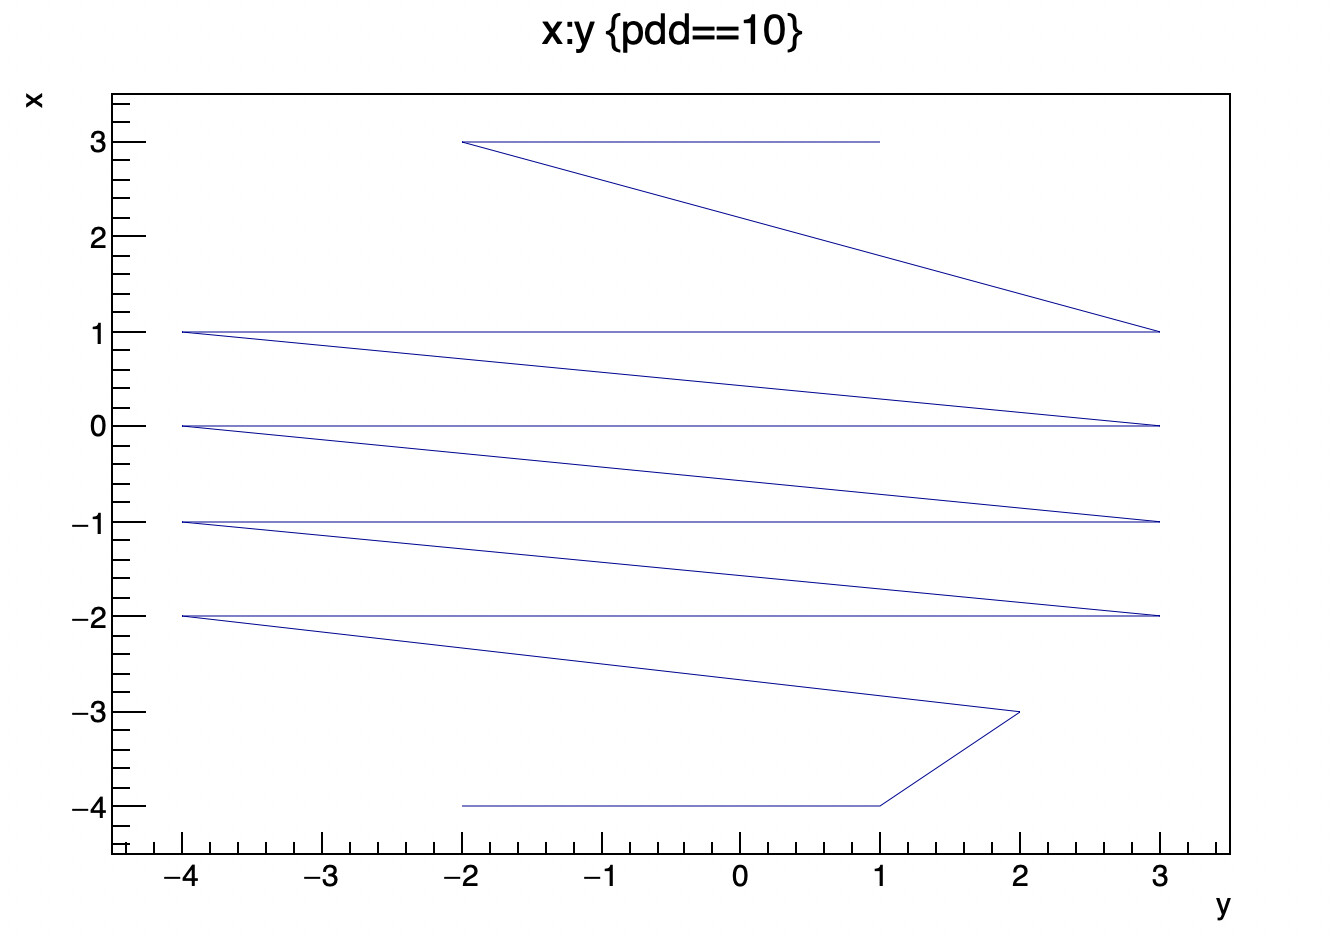
tree->Draw("x:y","pdd==10","C");
but this is my output:
i would like to connect points to each other like first curve.
how can i do this?
thanksresult.root (605.1 KB)
Maybe @couet can give more details, but to draw contours only, use the CONT1 or CONT3 option
couet
May 6, 2021, 12:27pm
3
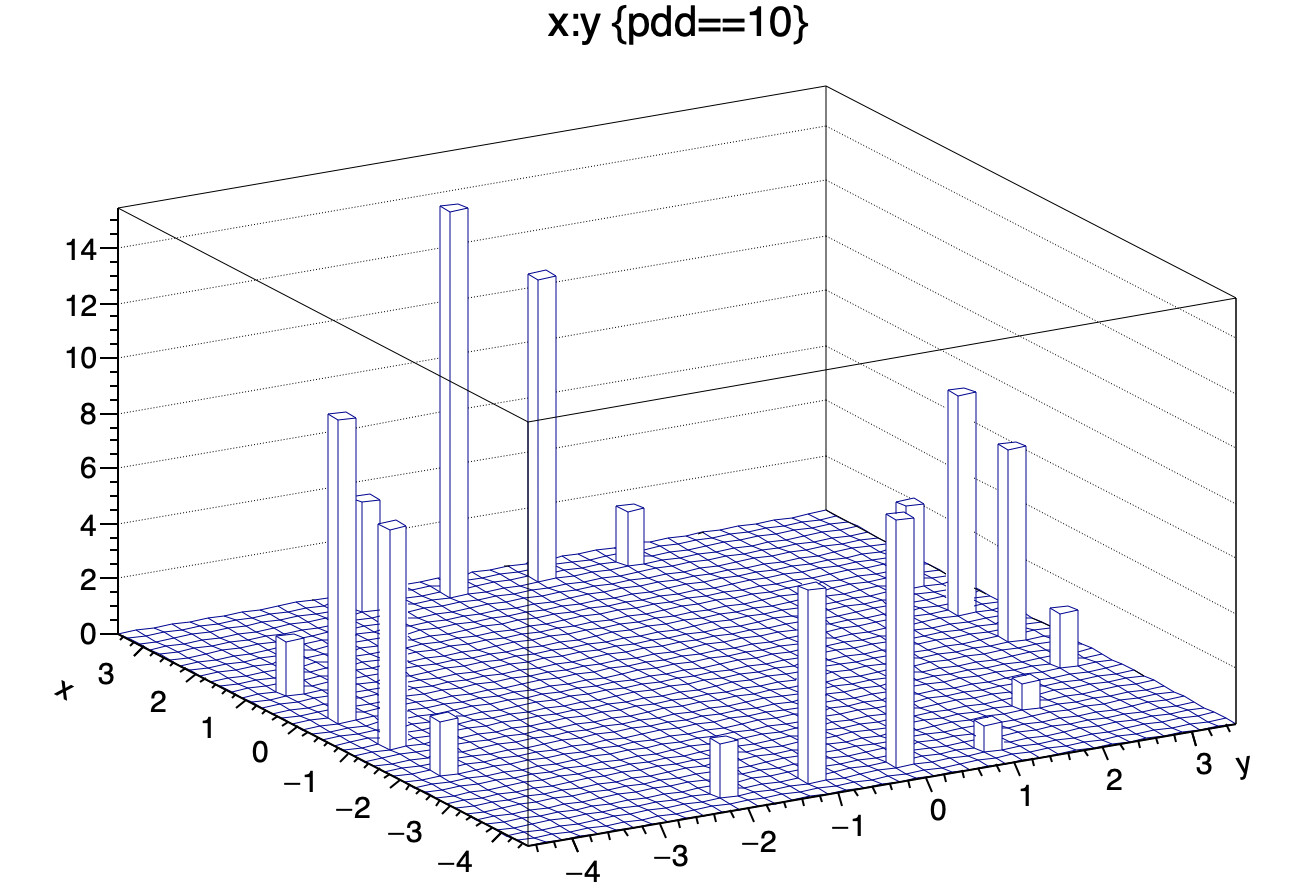
Your histogram is:
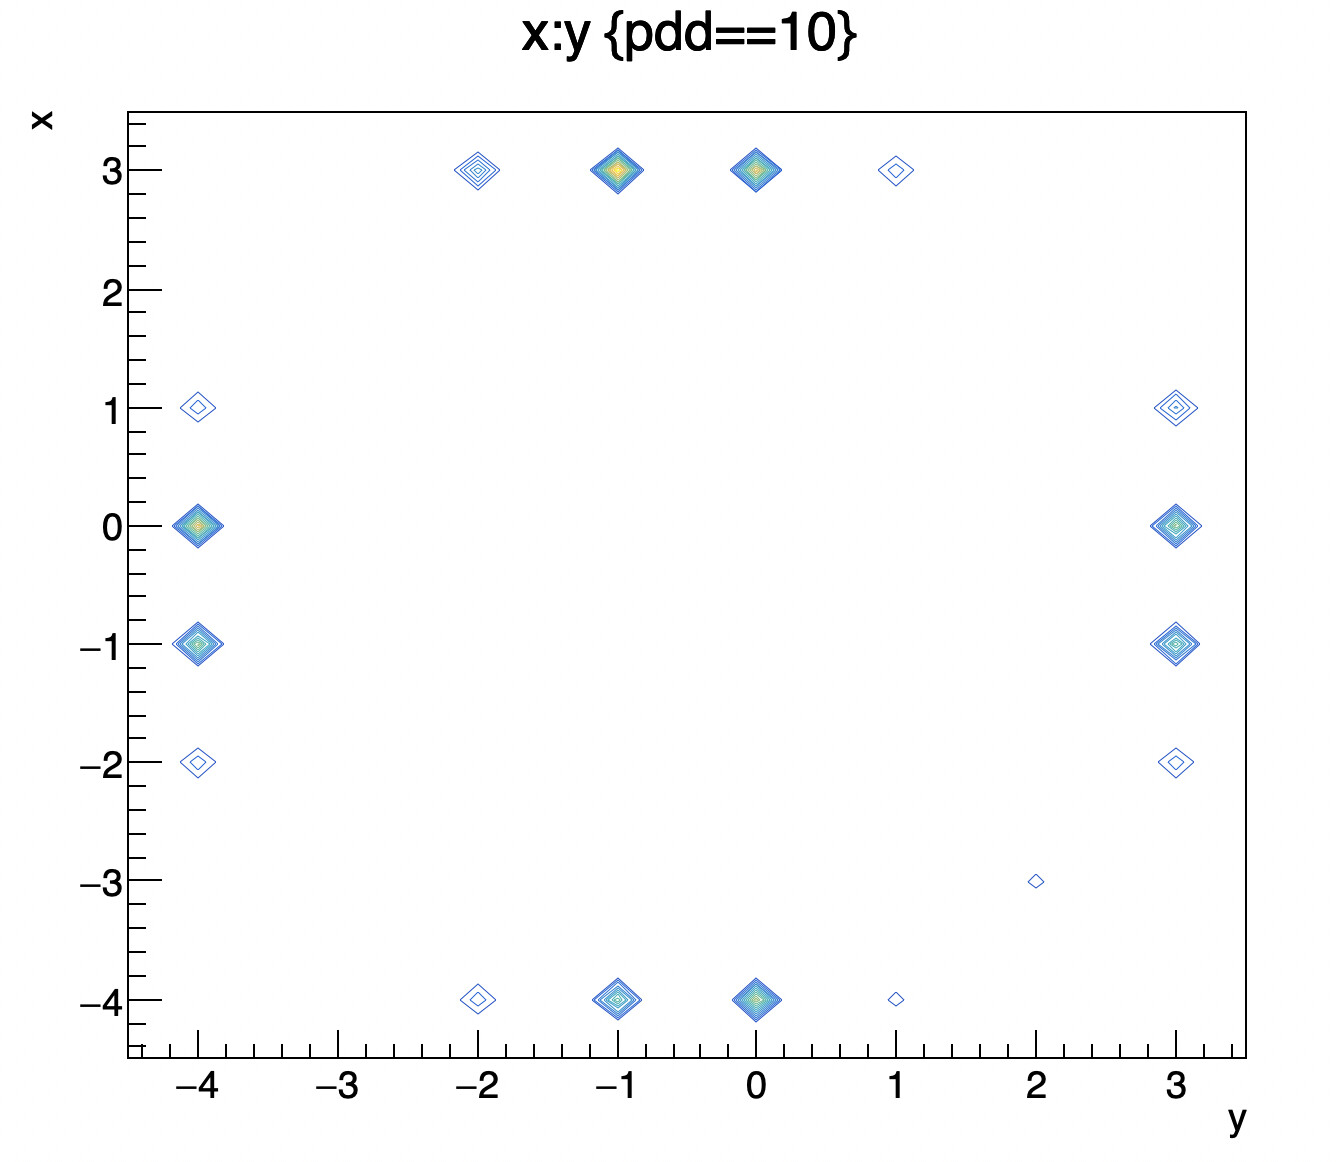
So a contour with any of the CONT option with not draw the plot you are looking for. For instance CONT1 gives:
if you use
tree->Draw("x:y","pdd==10","L");
A graph with point line-connected will be produced but, has the points are not properly ordered, you will get:
The only way I can think of would be to extract the non empty bins from the histogram or the points of the TGraph when option L is used and order them properly to generate a contour.
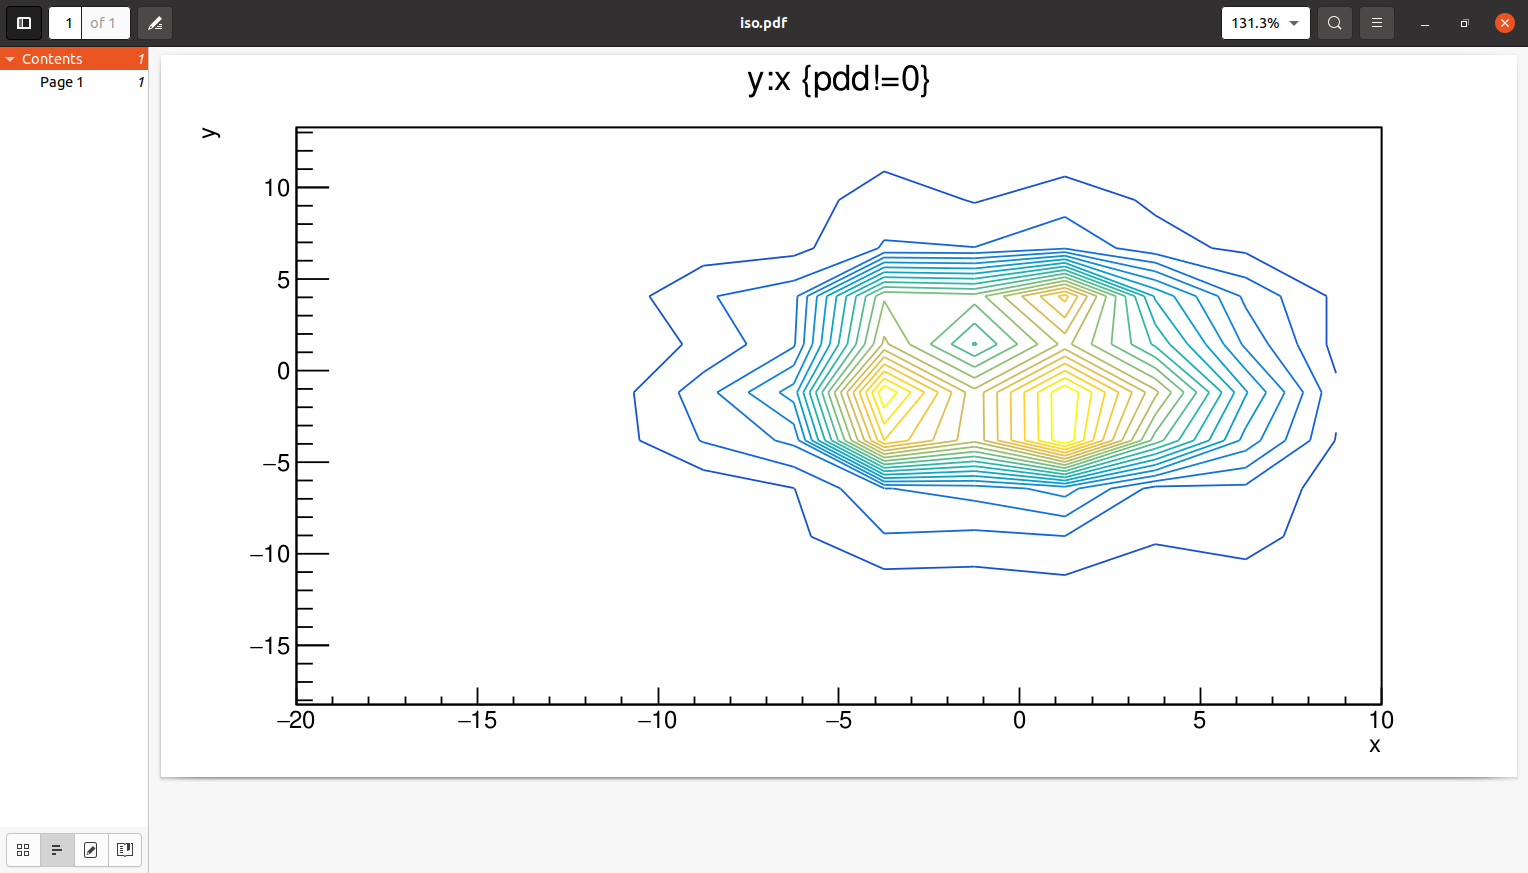
thank you all for your responding CONT1 option and got this output
it is what i wanted.
is there a way to put number on each contour like first picture which i sent in first post ?
couet
May 6, 2021, 2:18pm
5
This is not foreseen by the option itself.ROOT: tutorials/hist/ContourList.C File Reference