I have drawn everything, except the lines that separate the percentages (0-5%, 5-10%…). I would like to know how to implement it, since the only similar example that I have found, (cant put the link since I am a newbie) draws a full line that goes from one side to the other. I have just done the standard:
I don’t think this is a 2D histogram, but 1D, for which the option “colz” doesn’t exist, so remove that.
Assuming you want the shaded areas to match/follow the top edge of a histogram, there are several ways to do it, but in this case I think the simplest is to just make 7 histograms (say, h[0] to h[6]) using the same data of the “full” histogram but each of the ‘sub-histos’ with a different lowest bin (but all histos with same bin width and bin edges, ensuring that the bins overlap perfectly).
Say the full range you want in the x-axis is from 0 to 580, then you can do h[0] from 0 to 580, h[1] with 20 to 580 (20 or whatever value corresponds to the left edge of 60-80%), h[2] with 50 to 580, and so on. Then you:
do h[i]->SetFillColor(17); for i=1,3,5 (corresponding to 60-80%, 20-40% and 5-10%)
draw all in order from i=0 to 6 but using the option “SAME” (h[i]->Draw("SAME");) for i>0. The order matters, as ROOT will draw subsequent things on top of what is already drawn.
And then draw the rest of stuff (red line,…). Of course, modify other options as needed, but this should give you the idea.
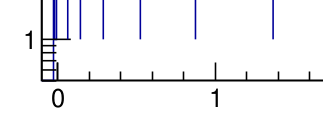
Thank you for your help. I have implemented a code applying what you exactly indicated, however the lines for some strange reason don’t touch the axis. Here is an example.
Do you know what could be the problem?
I have for example:
TH1F *histo= new TH1F(“histo”, “Distribution”, 310 , -0.1, 3.);
TH1F *histo1= new TH1F(“histo1”, “Distribution”, 295 , 0.05, 3.);
TH1F *histo2= new TH1F(“histo2”, “Distribution”, 285 , 0.15, 3.);
Thank you for your reply, I can post the complete extract of the code, although it is basically what I posted on my last reply but with the supplemental bins. However for the root file containing the data I cannot post it since it is 10GB+ and protected. Would that be enough?
1 - Why do you have several lines of the same c->SaveAs? As far as I know, multipage does not exist in PNG files, so adding “[” and “]” doesn’t work, unless these are saved as layers (I don’t know if PNG supports several layers anyway). I don’t know what ROOT does here, but probably you are overwriting the image every time, and even if these were somehow saved as layers, this is not what you want here; you only need to save the canvas once, after drawing the last thing that goes in it.
2 - As couet said, it is best to show a complete, but minimal, example that can be run to see exactly where is the issue; as it is now, you may be leaving out lines of code that could be affecting what you get. As for the data file, you can make a new root file (that now you can share) with a small subset of the data that you use and that still shows the issue.
We really need we something minimal reproducing the issue. The title of your post mentions “line drawing”. In the few line of code you sent, there is nowhere some “line drawing”. It is really difficult to help you with what you sent.
I am sorry, I meant “.pdf”. I have many other plots and I put them all in one pdf file.
Thanks, I will try to do so.
Yes, I meant lines that separate the centrality bins, as shown in the example. The code I sent was implementing the solution that dastudillo suggested.
I will try to post the code and a small root file.