Hi, I’m new to Root, and I’m trying to draw a set of points ((x,y) coordinates in a .txt) on top (as in, in the same graph) of a 2D histogram (a TH2C I’ve managed to draw on a canvas, with “colz”). I’ve seen the TMultiGraph class, but from what I gather I don’t think it can be used with a TH2C.
How could I achieve this?
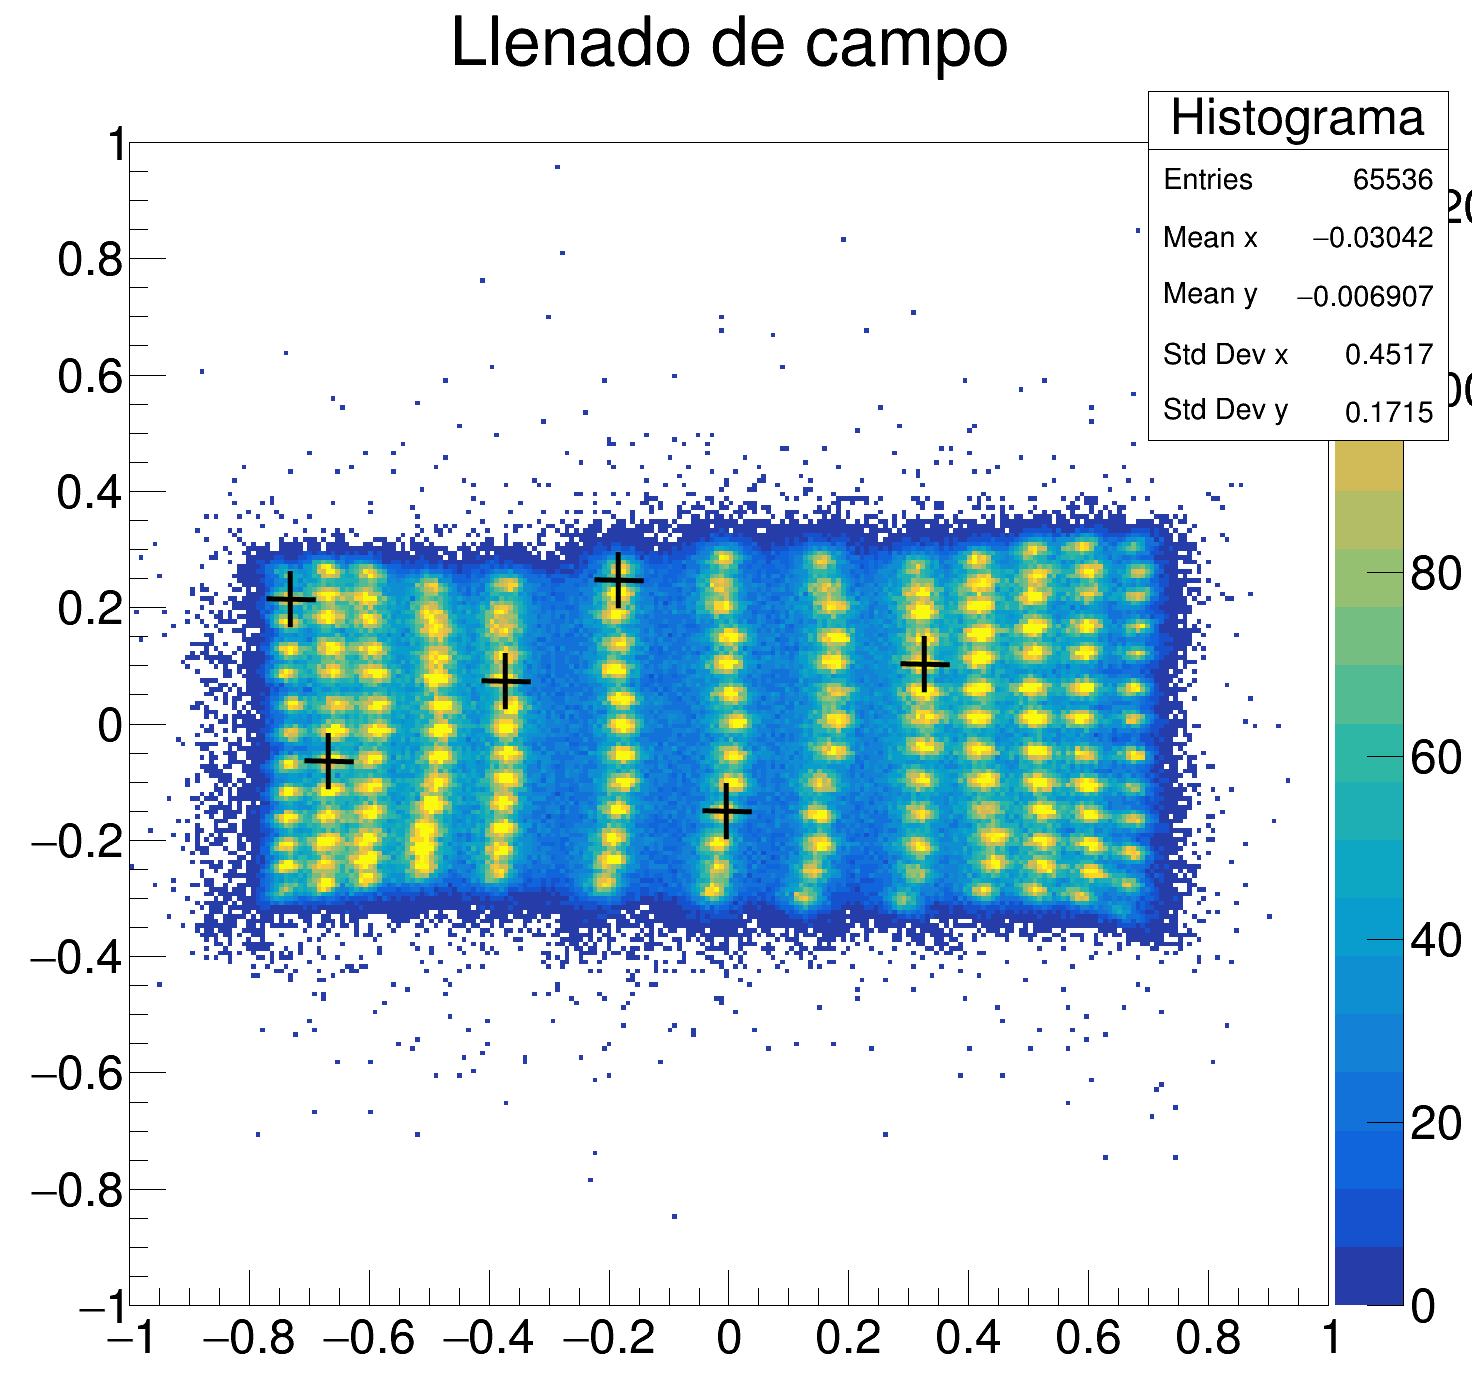
This is the code I have so far:
#include <stdio.h>
#include <stdlib.h>
#include <string.h>
#define MAXLINES 65536

int prueba()
{
    FILE* fp;
    char buffer[1000];
    double x[MAXLINES];
    double y[MAXLINES];
    int counts[MAXLINES];
    size_t lines = 0;
    size_t i;

    // Open file in reading mode
    fp = fopen("anger-integral.txt", "r");
    // Check if the file has been opened
    if (NULL == fp) {
        printf("file can't be opened \n");
        return 1;
    }
    // Read line by line and save the values in corresponding variables
    while (fgets(buffer, sizeof buffer, fp) != NULL) {
        if (sscanf(buffer, "%lf%lf%i",
                   &x[lines], &y[lines], &counts[lines]) == 3) {
            ++lines;
        }
    }
    // Close the file
    fclose(fp);

    // Histogram size and limits
    int binN = 256;
    int xmin = -1, xmax = 1;
    int ymin = -1, ymax = 1;

    // Create root canvas
    TCanvas* c_1 = new TCanvas("c_1","Llenado de campo", 1000,0, 1500,1500);
    // Create histogram
    TH2C* htwoD = new TH2C("Histograma","Llenado de campo", binN, xmin, xmax, binN, ymin, ymax);
    // Fill histogram with read data
    for (i = 0; i < lines; i++) {
      htwoD->Fill(x[i],y[i],counts[i]);
    }
    // Draw histogram to canvas
    htwoD->Draw("colz");

    return 0;
}
Thank you in advance.
ROOT Version: 6.26/10
Platform: Ubuntu 22.04
Compiler: Not Provided