Hello, I have done a very simple fit:
pdf_model = R.RooAddPdf('pdf_model','pdf_model', R.RooArgList(*pdf_list), R.RooArgList(*N_list))
pseudo_data = pdf_model.generate(vars, RF.Extended())
result = pdf_model.fitTo(pseudo_data, RF.Save(R.kTRUE))
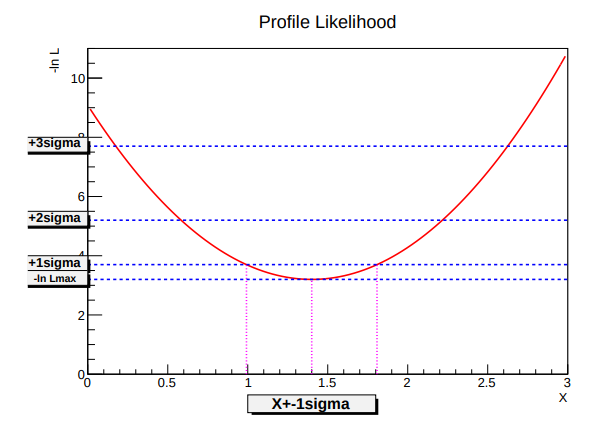
My parameter of interest is N_list[3]. What’s the fastest way to draw the profile likelihood? I would like something like this:
Dear @mdgalati ,
Thanks for your question. There is a RooFit tutorial showing plots with the profile likelihood at ROOT: tutorials/roofit/rf605_profilell.py File Reference . I see usage of RooAbsReal::plotOn together with a RooPlot object created from the desired parameter. Hope this helps a bit.
Cheers,
Vincenzo
Hi @vpadulan, many thanks for your answer.
In case it might help someone else, here’s a functioning snippet for Python:
N_sig = N_list[3]
nll = pdf_model.createNLL(pseudo_data, RF.Extended())
minimizer = R.RooMinimizer(nll)
minimizer.migrad()
frame = N_sig.frame(RF.Bins(10), RF.Range(0, 1000), RF.Title("Profile Likelihood in N_sig"))
pll_N_sig = nll.createProfile(N_sig)
pll_N_sig.plotOn(frame, RF.LineColor(R.kRed))
frame.SetMinimum(0)
frame.SetMaximum(3)
c = R.TCanvas("profile_likelihood", "Profile Likelihood", 800, 400)
frame.GetYaxis().SetTitleOffset(1.4)
frame.Draw()
c.SaveAs(f"{output_now}_pLL.pdf")
c.Close()