Hi,
Is there a way to draw the z axis (the palette) on the top of a histogram and orientating the ticks accordingly (instead of the standard display on the right side)? For example something similar to the option Draw(“colz,X+”) which draws the x axis on the top.
Hi,
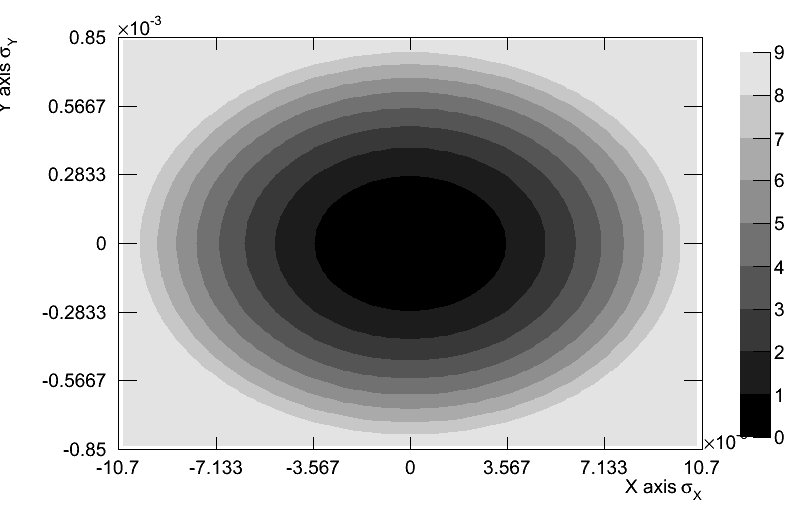
Thanks for your answer. But if I run your macro I get the following output (with the palette on the right). Or did I miss something?
I know you can translate it with setYNDC() and so on, but would like to have it on top (so effectively rotate it).
I Could not find any method to do this on the web.