Dear experts,
I have 3 histograms, h18, h17, h16 and i want to fit each of them with gaussian function. After fitting, i want to draw all three of them in a single canvas - the points as well as the fitted curve. I wrote this code:
void fit_plot(){
TFile* f18 = new TFile("18D_v3.root","open");
TH1F* h18 = (TH1F*)(f18->Get("demo/h4"));
h18->SetMarkerColor(2);
h18->SetLineColor(2);
h18->Sumw2();
TFile* f17 = new TFile("17F_v3.root","open");
TH1F* h17 = (TH1F*)(f17->Get("demo/h4"));
h17->SetMarkerColor(1);
h17->SetLineColor(1);
h17->Sumw2();
TFile* f16 = new TFile("16H_v3.root","open");
TH1F* h16 = (TH1F*)(f16->Get("demo/h4"));
h16->SetMarkerColor(3);
h16->SetLineColor(3);
h16->Sumw2();
h16->Scale(1.0/h16->Integral());
h17->Scale(1.0/h17->Integral());
h18->Scale(1.0/h18->Integral());
TCanvas c;
h16->Fit("gaus");
h17->Fit("gaus");
h18->Fit("gaus");
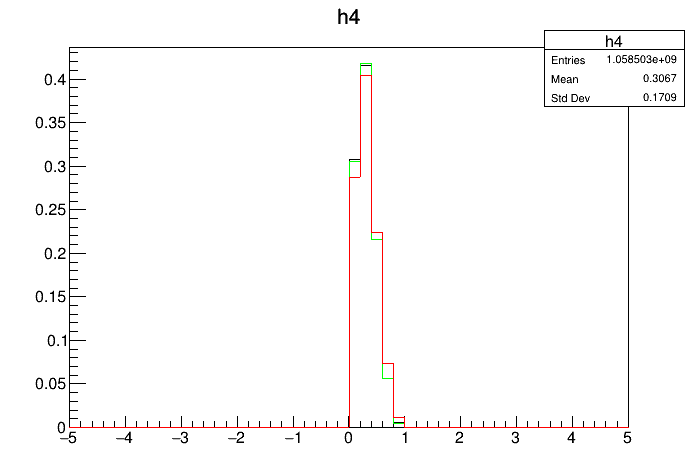
h17->Draw("HIST");
h16->Draw("HISTsame");
h18->Draw("HISTsame");
c.SaveAs("scaled.png");
}
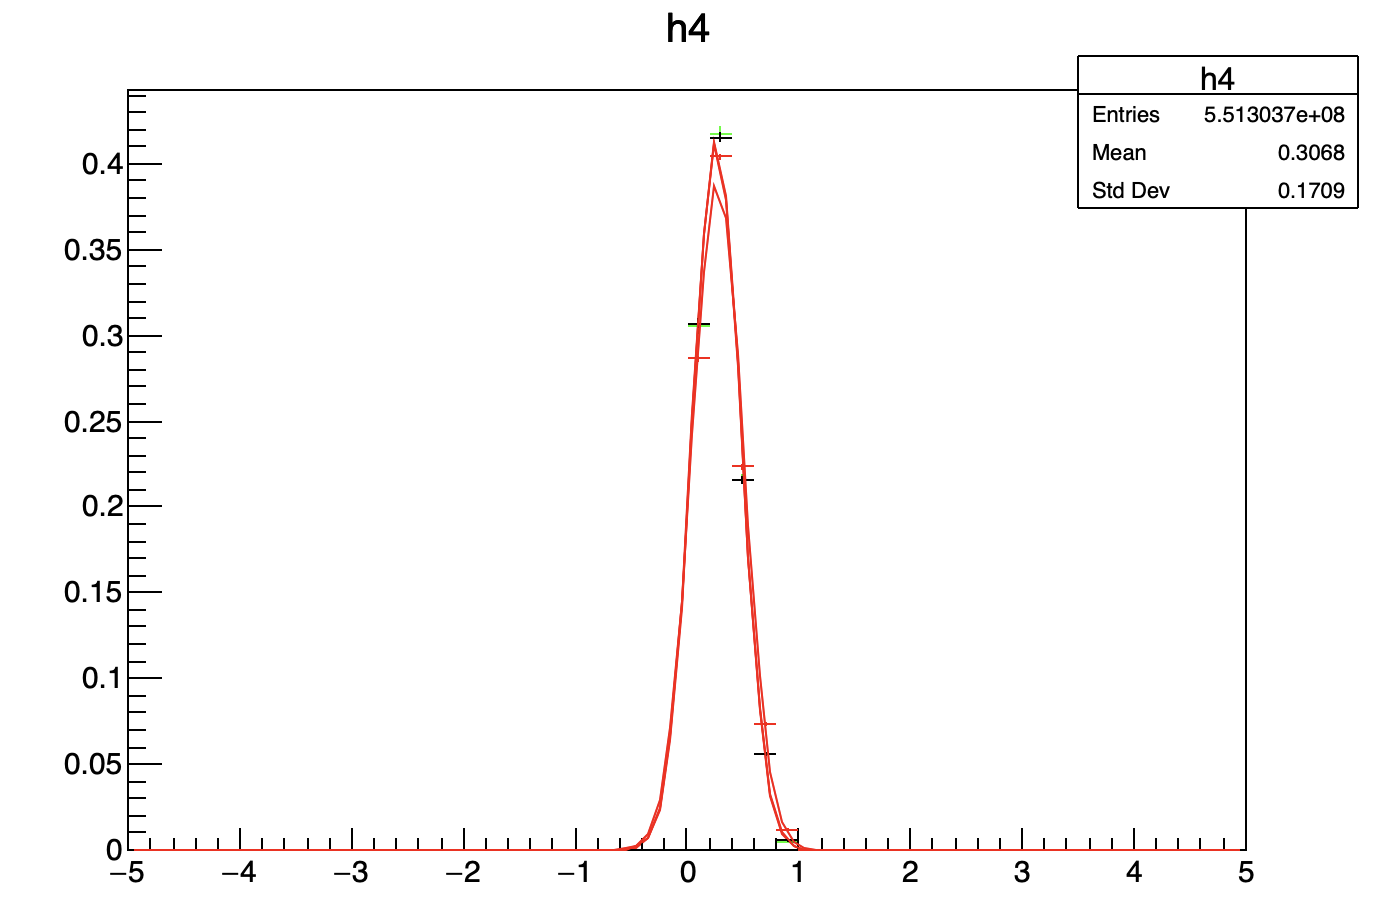
But what i get is just the points and not the fitted curve (plot attached).
16H_v3.root (6.5 KB)
17F_v3.root (6.5 KB)
18D_v3.root (6.5 KB)
Please read tips for efficient and successful posting and posting code
ROOT Version: ROOT 6.18/04
Platform: Linux
Compiler: Not Provided