Draw histogram with logarithmic x-axis with custom range

I have been working on making a few plots and I have ran into a bit of unexpected behaviour. It may be that I am doing things in an unusual way and there is a better way to do it, in which case I would be grateful for pointers to lead me in the correct direction. Or it could also be that I have ran into a bug, in which case I would be happy to submit a bug report if it is warranted.

Essentially, I have a histogram with uniform bins where the first bin starts at 0 (the code actually has several histograms, but one is enough to demonstrate the issue). I need to display the histogram with a logarithmic x axis. When I do this, ROOT chooses the lower edge for the first bin with some criteria I am not aware of. I want to specify this lower edge in order to have control of the visual of the plot. I have tried calling SetAxisRange() on the histogram, but it does not allow me to set an edge in the middle of a bin (even though ROOT has already done so), the same stands for GetXaxis().SetRange() and GetXaxis().SetRangeUser().

I then tried to plot a separate histogram which serves as a “frame”, with a different range, in order to define the plot axis limits and then draw the histogram I want on top with the option “same”. This works perfect and exactly as expected for a linear x-axis. But with the logarithmic x-axis, the edges of the bins are actually shifted and modified, which is very unexpected and I would argue is a bug.

I show below a MWE where I exaggerate the lower edge of the plot in order to make the shifting of the bin edges in the last step clearly evident.

So, if someone could confirm this last thing is indeed a bug, I would be happy to submit the bug report. In addition, I would be very happy if someone could help point me toward a solution to plot a histogram starting at 0, with a logarithmic x-axis but controlling the place where the x-axis starts.


ROOT Version: 6.24
Platform: Working on SWAN, using a python notebook (i.e. PyROOT)


MWE, for Jupyter below:

from ROOT import TCanvas, TH2D, TH1D

frame = TH2D("frame", "", 100, 24, 100, 100, 10, 100)
frame.SetStats(False)
frame.GetXaxis().SetTitle("Deadtime [ns]")
frame.GetYaxis().SetTitle("Pad Size [#mum]")

hist = TH1D("padSize_vs_deadtime", "Pad Size vs Deadtime", 4, 0, 100)
hist.SetBinContent(1, 60)
hist.SetBinContent(2, 45)
hist.SetBinContent(3, 30)
hist.SetBinContent(4, 15)
# Histogram bin edges are at: 0, 25, 50, 75, 100

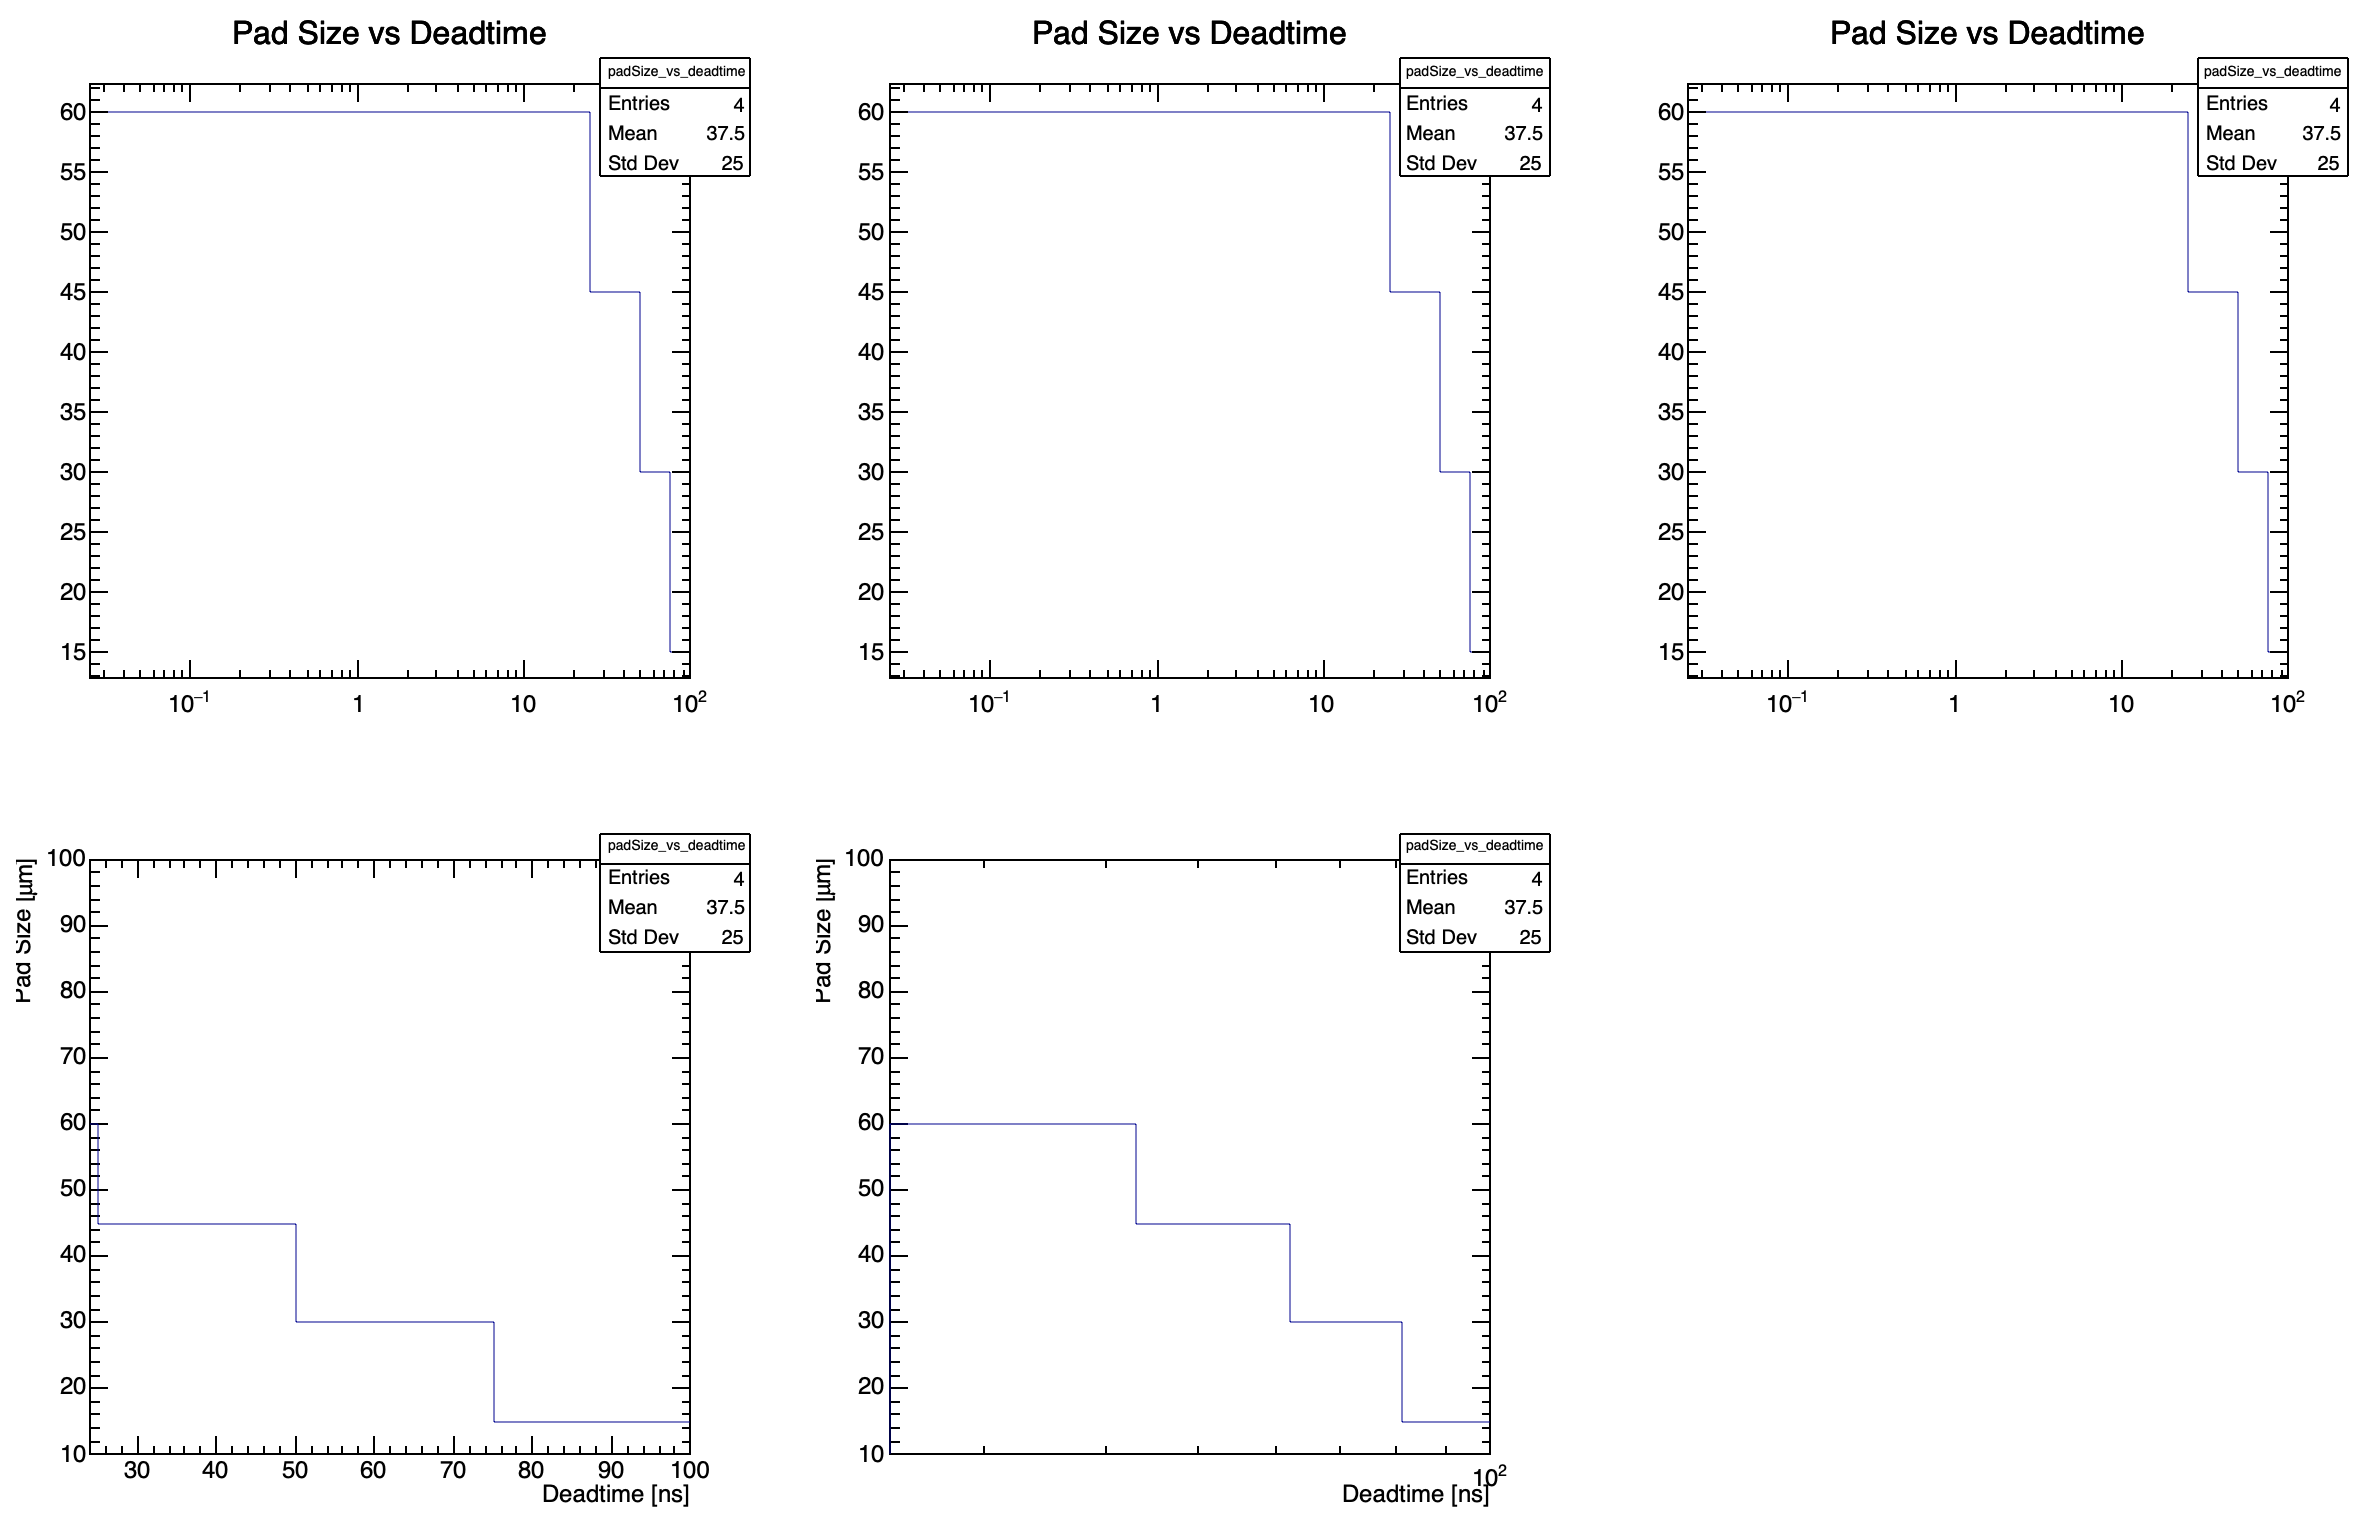
canv = TCanvas("padSize_vs_deadtime", "Pad Size vs Deadtime", 1200, 800)
canv.Divide(3,2)

pad = canv.cd(1)
pad.SetLogx()
pad.SetTicks()
hist.Draw("")
hist.SetAxisRange(10, 100, "X")
# Displayed plot x-axis edge is ~0.025

pad = canv.cd(2)
pad.SetLogx()
pad.SetTicks()
hist.Draw("")
hist.GetXaxis().SetRange(10, 100)
# Displayed plot x-axis edge is ~0.025

pad = canv.cd(3)
pad.SetLogx()
pad.SetTicks()
hist.Draw("")
hist.GetXaxis().SetRangeUser(10, 100)
# Displayed plot x-axis edge is ~0.025

pad = canv.cd(4)
pad.SetTicks()
frame.Draw()
hist.Draw("same")
# Works exactly as expected and the edge of the plot x-axis is 24
# Displayed histogram bin edges are at: 25, 50, 75 (as expected)


pad = canv.cd(5)
pad.SetLogx()
pad.SetTicks()
frame.Draw()
hist.Draw("same")
# The edge of the plot x-axis is 24 (as desired)
# Displayed histogram bin edges are shifted significantly: ~40 (25 expected), ~60 (50 expected), ~80 (75 expected)
# Histogram data is misrepresented, bug?


canv.Draw()

To make sure we are talking about the same thing I converted your code in C++ (just to avoid some Python artefacts). The macro is now:

{
   auto frame = new TH2D("frame", "", 100, 24, 100, 100, 10, 100);
   frame->SetStats(kFALSE);
   frame->GetXaxis()->SetTitle("Deadtime [ns]");
   frame->GetYaxis()->SetTitle("Pad Size [#mum]");

   auto hist = new TH1D("padSize_vs_deadtime", "Pad Size vs Deadtime", 4, 0, 100);
   hist->SetBinContent(1, 60);
   hist->SetBinContent(2, 45);
   hist->SetBinContent(3, 30);
   hist->SetBinContent(4, 15);

   auto canv = new TCanvas("padSize_vs_deadtime", "Pad Size vs Deadtime", 1200, 800);
   canv->Divide(3,2);

   pad = canv->cd(1);
   pad->SetLogx();
   pad->SetTicks();
   hist->Draw("");
   hist->SetAxisRange(10, 100, "X");

   pad = canv->cd(2);
   pad->SetLogx();
   pad->SetTicks();
   hist->Draw("");
   hist->GetXaxis()->SetRange(10, 100);

   pad = canv->cd(3);
   pad->SetLogx();
   pad->SetTicks();
   hist->Draw("");
   hist->GetXaxis()->SetRangeUser(10, 100);

   pad = canv->cd(4);
   pad->SetTicks();
   frame->Draw();
   hist->Draw("same");

   pad = canv->cd(5);
   pad->SetLogx();
   pad->SetTicks();
   frame->Draw();
   hist->Draw("same");

   canv->Draw();
}

It gives me:

Which plot is wrong seems to you ?

I see I am looking at it.

The problem is that your histogram has only 4 bins and SetRange and SetRangeUser ultimately are also bin wise. They call SetRange.

Hi,

Thanks for the feedback. So, the plots in pads 1,2,3 were just attempts on my part to try to find a solution. Effectively, root is deciding to display the first bin from ~0.025 (because it is impossible to plot from the start of the bin since log(0) = -inf). As you can see in these examples, this squishes the other bins excessively. So I want to be able to control the point from where the drawing starts. Root is already not showing the full first bin, so it should be possible to somehow specify this point.

The plot in pad 4 does exactly what I want, but without the log x-axis.

The plot in pad 5 seems to have some sort of bug… the edges of the bins are not in the correct positions.

Since ROOT doesn’t let you “cut” or zoom in into fractions of a bin, you need to have more bins.
One alternative is to use an empty histogram with enough bins so that SetLimits works as expected, and then draw your histogram on top of that. Try:

{
   TH1D *hist = new TH1D("padSize_vs_deadtime", "Pad Size vs Deadtime", 4, 0.5, 100.5);
   hist->SetBinContent(1, 60);
   hist->SetBinContent(2, 45);
   hist->SetBinContent(3, 30);
   hist->SetBinContent(4, 15);

   TH1D *h2 = new TH1D("temp", "Pad Size vs Deadtime", 100, 0, 100);  // use the title we want to see

   TCanvas *canv = new TCanvas("padSize_vs_deadtime", "Pad Size vs Deadtime", 800, 600);
   canv->SetLogx();
/*
   // Using the histo from a TGraph can also work
   const int N = 4;
   double x[N] = {25,50,75,100};
   double y[N] = {60,45,30,15};
   TGraph *g = new TGraph(N,x,y);
   g->Draw("AL");
   g->GetXaxis()->SetLimits(15,100);
   TH1D *h = (TH1D*)g->GetHistogram();
   h->GetXaxis()->SetMoreLogLabels();
   h->Draw();
*/
   h2->SetStats(0);  // so that its stats box is not shown
   h2->SetMaximum(65);
   h2->GetXaxis()->SetLimits(15,100);
   h2->GetXaxis()->SetMoreLogLabels();
   h2->Draw();
   hist->Draw("sames");  // "sames" to draw stats box for hist
   canv->Update();
}

In fact, the problem seems to be the log scale when the first bin’s lower edge is zero (in which case, ROOT moves things around). Your code works when the histogram does not start exactly at zero (as I also did in my example above):

{
   auto frame = new TH2D("frame", "", 100, 24, 100, 100, 10, 100);
   frame->SetStats(kFALSE);
   frame->GetXaxis()->SetTitle("Deadtime [ns]");
   frame->GetYaxis()->SetTitle("Pad Size [#mum]");

   auto hist = new TH1D("padSize_vs_deadtime", "Pad Size vs Deadtime", 4, 0.5, 100.5);
   hist->SetBinContent(1, 60);
   hist->SetBinContent(2, 45);
   hist->SetBinContent(3, 30);
   hist->SetBinContent(4, 15);

   auto canv = new TCanvas("padSize_vs_deadtime", "Pad Size vs Deadtime", 800, 600);
   canv->SetLogx();
   canv->SetTicks();
   frame->Draw();
   hist->Draw("same");
}

Thanks @dastudillo, so it seems my reasoning was correct it was just this “root moving things around” if the lower edge is 0 which was throwing me off. Is this expected? An offset of 0.5 for my purposes is not a problem, but for a more general solution it may be. Is this moving things around documented behaviour? I don’t recall seeing it mentioned anywhere, but I may have missed it.

Let me investigate last @dastudillo example.

The example is correct and can be improved the following way:

{
   auto c = new TCanvas("padSize_vs_deadtime", "Pad Size vs Deadtime", 800, 600);
   c->SetLogx();
   c->SetTicks();

   auto f = c->DrawFrame(24., 10., 100., 100.);
   f->GetXaxis()->SetTitle("Deadtime [ns]");
   f->GetYaxis()->SetTitle("Pad Size [#mum]");
   f->GetXaxis()->SetMoreLogLabels();
   f->GetXaxis()->SetTitleOffset(1.33);

   auto hist = new TH1D("hist", "hist", 4, 0.5, 100.5);
   hist->SetBinContent(1, 60);
   hist->SetBinContent(2, 45);
   hist->SetBinContent(3, 30);
   hist->SetBinContent(4, 15);

   hist->Draw("same");
}

It gives:

To summarise all the SetRangeXXX() methods are all bin based. If you want to have define a range not based on the bins you have two ways:

  1. have a histogram with many bins. The bin width being the precession limits.
  2. Draw a frame first and Draw the histogram you want to “range” on top of it. Like in the above example.

This topic was automatically closed 14 days after the last reply. New replies are no longer allowed.