Hi, i am trying to draw plots like in Figure 4 here.
What i currently have is 3 histograms, one for data with full uncertainties, one for data with stat. uncertainties and one for MC with total uncertainties.
Currently i am drawing them like this (with the indices matching the above order)
    hists[2].SetLineColor(ROOT.kRed+1)
    hists[2].SetFillStyle(1001)
    hists[2].SetFillColorAlpha(ROOT.kRed+1, 0.5)
    hists[2].SetMarkerStyle(1)
    hists[2].SetMarkerColor(ROOT.kRed + 1)
    hists[2].SetLineStyle(1)
    hists[2].SetLineWidth(1)
    ROOT.gStyle.SetEndErrorSize(5)
    hists[2].GetYaxis().SetRangeUser(0.0, plotmax * factor)
    hists[2].GetYaxis().SetTitleOffset(1.0)
    hists[2].GetXaxis().SetLabelOffset(999)
    hists[2].Draw("E2")
    hists[2].Draw("same PEY0")
    hists[0].SetMarkerSize(1.0)
    hists[1].SetMarkerSize(1.0)
    hists[0].Draw("same P E0")
    hists[1].Draw("same P E1")
This results in a plot like this (ignore the ratio plot)
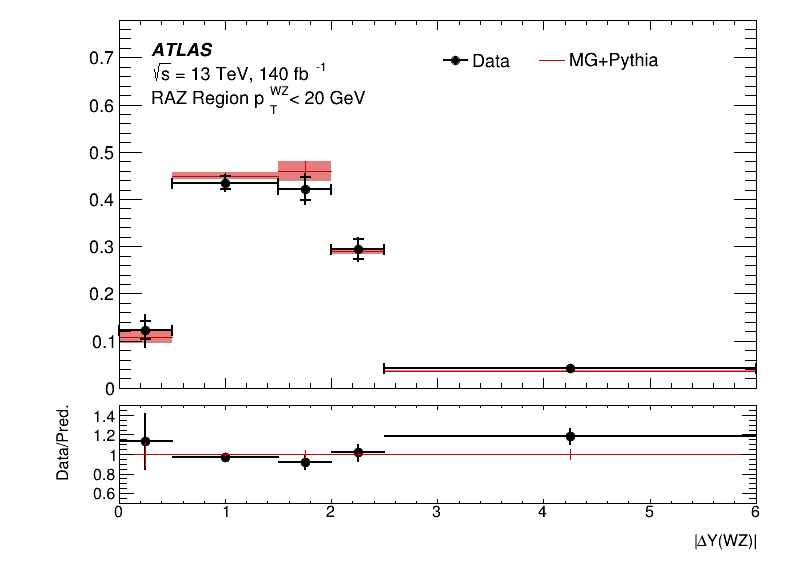
This is almost right except that the MC should only have a horizontal line and not a vertical one, and also i would like to connect the individual bins vertically like in the reference figure.
(Also ideally i would like to also get rid of the end bars on the horizontal errors, is there a way to do that?
And alos do make the uncertainty bands dashed?)
ROOT Version: 6.24/00