Try this:
{
TGraph *g1 = new TGraph();
g1->SetTitle("library 1");
g1->SetMarkerStyle(24); g1->SetMarkerColor(1); g1->SetLineColor(1);
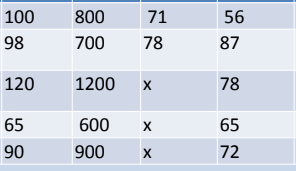
g1->SetPoint(g1->GetN(), 1, 100);
g1->SetPoint(g1->GetN(), 2, 98);
g1->SetPoint(g1->GetN(), 3, 120);
g1->SetPoint(g1->GetN(), 4, 65);
g1->SetPoint(g1->GetN(), 5, 90);
TGraph *g2 = new TGraph();
g2->SetTitle("library 2");
g2->SetMarkerStyle(25); g2->SetMarkerColor(2); g2->SetLineColor(2);
g2->SetPoint(g2->GetN(), 1, 800);
g2->SetPoint(g2->GetN(), 2, 700);
g2->SetPoint(g2->GetN(), 3, 1200);
g2->SetPoint(g2->GetN(), 4, 600);
g2->SetPoint(g2->GetN(), 5, 900);
TGraph *g3 = new TGraph();
g3->SetTitle("library 3");
g3->SetMarkerStyle(26); g3->SetMarkerColor(3); g3->SetLineColor(3);
g3->SetPoint(g3->GetN(), 1, 71);
g3->SetPoint(g3->GetN(), 2, 78);
// g3->SetPoint(g3->GetN(), 3, );
// g3->SetPoint(g3->GetN(), 4, );
// g3->SetPoint(g3->GetN(), 5, );
TGraph *g4 = new TGraph();
g4->SetTitle("library 4");
g4->SetMarkerStyle(27); g4->SetMarkerColor(4); g4->SetLineColor(4);
g4->SetPoint(g4->GetN(), 1, 56);
g4->SetPoint(g4->GetN(), 2, 87);
g4->SetPoint(g4->GetN(), 3, 78);
g4->SetPoint(g4->GetN(), 4, 65);
g4->SetPoint(g4->GetN(), 5, 72);
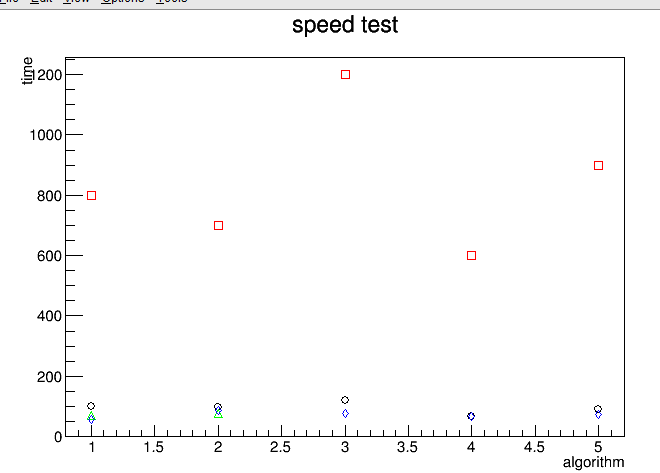
TMultiGraph *mg = new TMultiGraph();
mg->SetTitle("speed test;;time [s];");
mg->Add(g1); mg->Add(g2); mg->Add(g3); mg->Add(g4);
TCanvas *c = new TCanvas("c", "c");
gPad->SetLogy(1);
mg->Draw("APL");
TAxis *a = mg->GetXaxis();
if (a) {
a->SetBinLabel(a->FindFixBin(1), "algorithm 1");
a->SetBinLabel(a->FindFixBin(2), "algorithm 2");
a->SetBinLabel(a->FindFixBin(3), "algorithm 3");
a->SetBinLabel(a->FindFixBin(4), "algorithm 4");
a->SetBinLabel(a->FindFixBin(5), "algorithm 5");
a->LabelsOption("h");
}
#if ROOT_VERSION_CODE >= ROOT_VERSION(6,00,00)
gPad->BuildLegend(0.83, 0.83, 0.99, 0.99, "", "PL"); // ROOT 6
#else
g1->SetFillColor(0); g2->SetFillColor(0); g3->SetFillColor(0); g4->SetFillColor(0);
gPad->BuildLegend(0.83, 0.83, 0.99, 0.99, ""); // ROOT 5
#endif
}
and / or that:
{
  TGraph *g1 = new TGraph();
  g1->SetTitle("algorithm 1");
  g1->SetMarkerStyle(24); g1->SetMarkerColor(1); g1->SetLineColor(1);
  g1->SetPoint(g1->GetN(), 1, 100);
  g1->SetPoint(g1->GetN(), 2, 800);
  g1->SetPoint(g1->GetN(), 3, 71);
  g1->SetPoint(g1->GetN(), 4, 56);
  TGraph *g2 = new TGraph();
  g2->SetTitle("algorithm 2");
  g2->SetMarkerStyle(25); g2->SetMarkerColor(2); g2->SetLineColor(2);
  g2->SetPoint(g2->GetN(), 1, 98);
  g2->SetPoint(g2->GetN(), 2, 700);
  g2->SetPoint(g2->GetN(), 3, 78);
  g2->SetPoint(g2->GetN(), 4, 87);
  TGraph *g3 = new TGraph();
  g3->SetTitle("algorithm 3");
  g3->SetMarkerStyle(26); g3->SetMarkerColor(3); g3->SetLineColor(3);
  g3->SetPoint(g3->GetN(), 1, 120);
  g3->SetPoint(g3->GetN(), 2, 1200);
  // g3->SetPoint(g3->GetN(), 3, );
  g3->SetPoint(g3->GetN(), 4, 78);
  TGraph *g4 = new TGraph();
  g4->SetTitle("algorithm 4");
  g4->SetMarkerStyle(27); g4->SetMarkerColor(4); g4->SetLineColor(4);
  g4->SetPoint(g4->GetN(), 1, 65);
  g4->SetPoint(g4->GetN(), 2, 600);
  // g4->SetPoint(g4->GetN(), 3, );
  g4->SetPoint(g4->GetN(), 4, 65);
  TGraph *g5 = new TGraph();
  g5->SetTitle("algorithm 5");
  g5->SetMarkerStyle(28); g5->SetMarkerColor(5); g5->SetLineColor(5);
  g5->SetPoint(g5->GetN(), 1, 90);
  g5->SetPoint(g5->GetN(), 2, 900);
  // g5->SetPoint(g5->GetN(), 3, );
  g5->SetPoint(g5->GetN(), 4, 72);
  TMultiGraph *mg = new TMultiGraph();
  mg->SetTitle("speed test;;time [s];");
  mg->Add(g1); mg->Add(g2); mg->Add(g3); mg->Add(g4); mg->Add(g5);
  TCanvas *c = new TCanvas("c", "c");
  gPad->SetLogy(1);
  mg->Draw("APL");
  TAxis *a = mg->GetXaxis();
  if (a) {
    a->SetBinLabel(a->FindFixBin(1), "library 1");
    a->SetBinLabel(a->FindFixBin(2), "library 2");
    a->SetBinLabel(a->FindFixBin(3), "library 3");
    a->SetBinLabel(a->FindFixBin(4), "library 4");
    a->LabelsOption("h");
  }
#if ROOT_VERSION_CODE >= ROOT_VERSION(6,00,00)
  gPad->BuildLegend(0.74, 0.7, 0.9, 0.9, "", "PL"); // ROOT 6
#else
  g1->SetFillColor(0); g2->SetFillColor(0); g3->SetFillColor(0); g4->SetFillColor(0); g5->SetFillColor(0);
  gPad->BuildLegend(0.74, 0.7, 0.9, 0.9, ""); // ROOT 5
#endif
}