hammiu
July 28, 2020, 3:43am
1
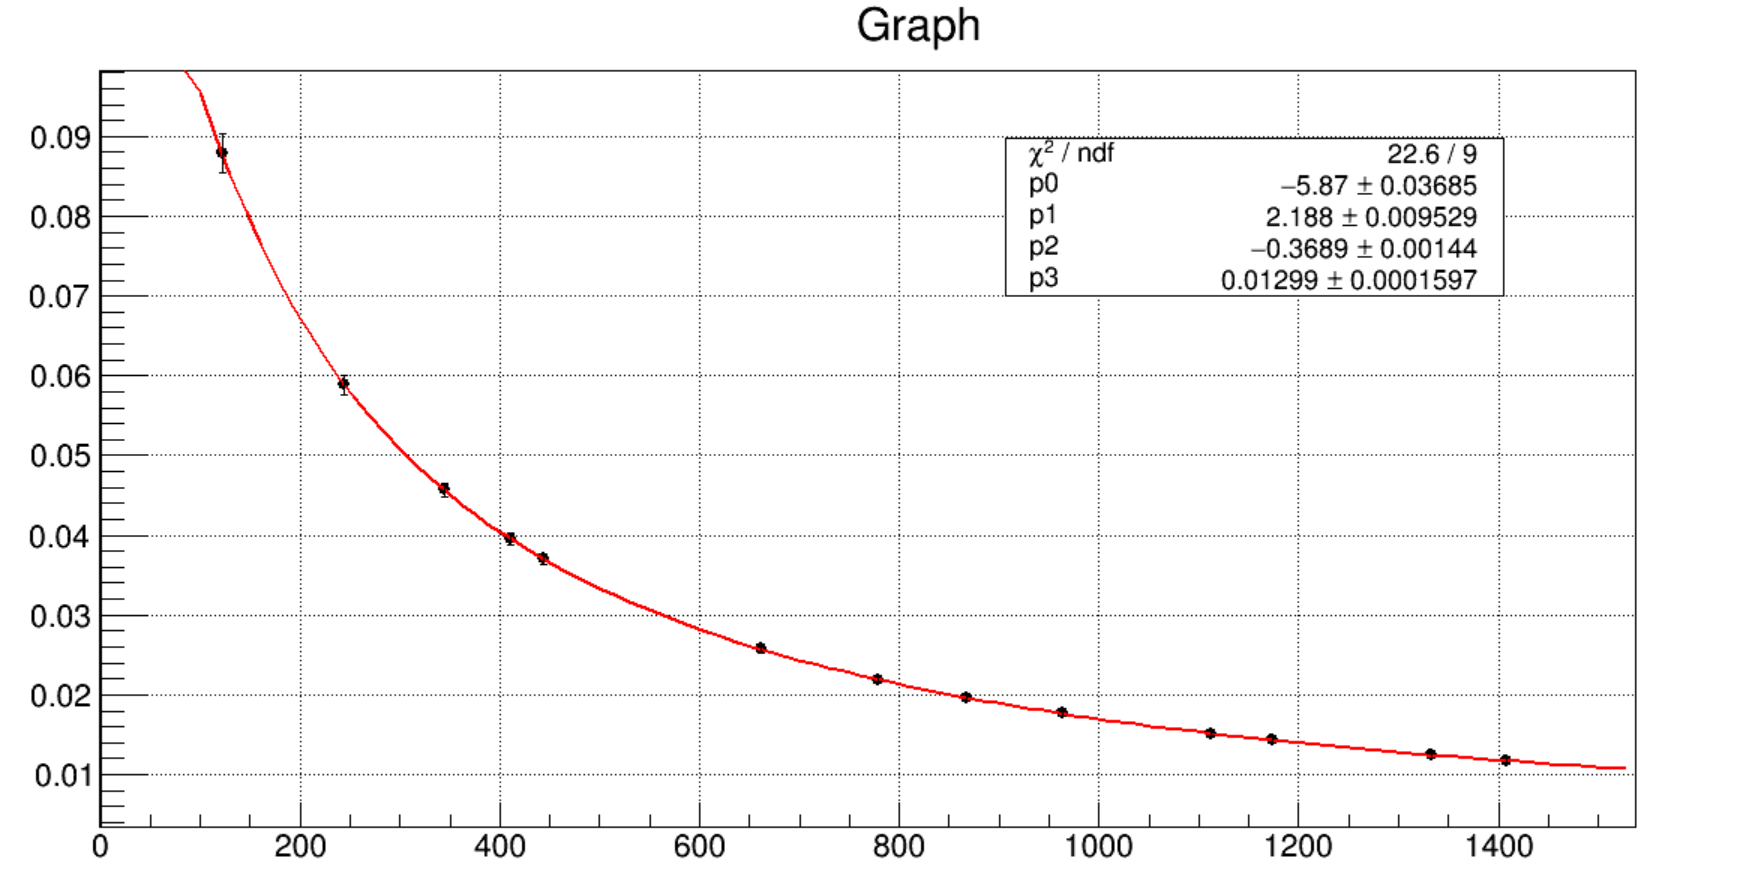
I have a graph with its errors. I create a fit function for that graph. And I want to draw fit function with its errors. Could you help me, please?
#include <TGraphErrors.h>
#include <TCanvas.h>
#include <TF1.h>
#include <TVirtualFitter.h>
void alo()
{
   TCanvas *c = new TCanvas("c","alo",700,500);
   c->SetGrid();

   TGraphErrors *g = new TGraphErrors("cm0.txt");
   g->Draw("AP");
   g->SetMarkerStyle(8);

   TF1 *fit =new TF1("fit", "exp([0] + [1]*log(x) + [2]*((log(x))^2) + [3]*((log(x))^3))", 0 , 2000);
   g->Fit("fit");

   TVirtualFitter::GetFitter()->GetConfidenceIntervals(g, 0.95);
}
Here is my code and plot. But the uncertainty of fit function wasn’t draw.
couet
July 28, 2020, 7:14am
2
it looks like that’s what you get ? Am I wrong ?
I guess @hammiu would like to plot the errors of the fit as a band (something like here ).
hammiu
July 28, 2020, 2:40pm
4
Yes, I want to draw a band of fit function.
hammiu
July 28, 2020, 2:42pm
5
Hi @hammiu ,tutorial may help you with that. Looking at the code of your first post it may be that all you need is to first call TVirtualFitter::GetFitter()->GetConfidenceIntervals and only call Draw at the end.
hammiu
July 29, 2020, 9:10am
7
I don’t know exactly command to draw the band.
hammiu
July 29, 2020, 9:12am
8
Could you help me, please? I want to draw a band of fit function (like https://micropore.files.wordpress.com/2017/02/fit1.png
Sorry, what I meant is a slight modification of your initial code
#include <TGraphErrors.h>
#include <TCanvas.h>
#include <TF1.h>
#include <TVirtualFitter.h>
void alo()
{
   TCanvas *c = new TCanvas("c","alo",700,500);
   c->SetGrid();

   TGraphErrors *g = new TGraphErrors("cm0.txt");

   TF1 *fit =new TF1("fit", "exp([0] + [1]*log(x) + [2]*((log(x))^2) + [3]*((log(x))^3))", 0 , 2000);
   g->Fit("fit");

   TVirtualFitter::GetFitter()->GetConfidenceIntervals(g, 0.95);

   g->Draw("AP");
   g->SetMarkerStyle(8);
}
Note the call to Draw only at the end.
hammiu
July 29, 2020, 1:02pm
10
Thank you, but the result is same, not confidence band.cm0.txt (456 Bytes)
couet
July 29, 2020, 2:32pm
11
may be;
void alo()
{
   TCanvas *c = new TCanvas("c","alo",700,500);
   c->SetGrid();

   TGraphErrors *g = new TGraphErrors("cm0.txt");

   TF1 *fit =new TF1("fit", "exp([0] + [1]*log(x) + [2]*((log(x))^2) + [3]*((log(x))^3))", 0 , 2000);
   g->Fit("fit");

   TVirtualFitter::GetFitter()->GetConfidenceIntervals(g, 0.95);
   g->SetFillColor(kBlue);
   g->Draw("A E3");
   g->SetMarkerStyle(8);
   g->Draw("P");
}
hammiu
July 30, 2020, 5:39am
12
Thank you so much for your guidance. It work properly.