Draw and label extra Y axis

Dear All:

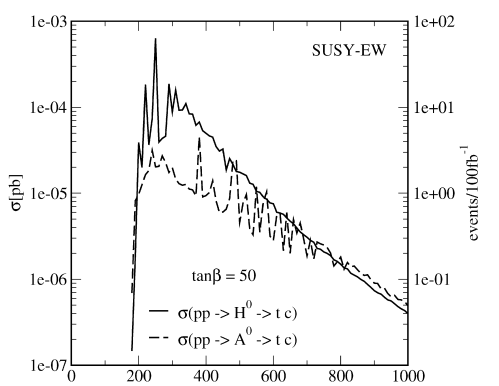
I am looking for the best way to make in ROOT a 1D-plot with two Y-axis, so just ideas not the macro itself. The plot should look like: on the left showing the x-section of a given reaction and the axis to the right showing the amount of events per fb^{-1} of collected data for the x-section. There is a nice example attached.

thanks in advance,

arian

gaxis.C: Simple example illustrating how to draw TGaxis objects in various formats.
manyaxis.C: show several TGaxis formats
transpad.C: Example of a canvas showing two histograms with different scales.
twoscales.C: example of macro illustrating how to superimpose two histograms

dear coyote:

thanks, all your suggestions were helpful.

cheers,