Here is an example of my use case: I have four detector elements, whose current state I need to depict as a 2x2 2D plot. Five colours must roughly represent the values.
Red:    2<v
Orange: 1<v<2
Green:    v<1
Green: -1<v
Azure: -2<v<-1
Blue:     v<-2
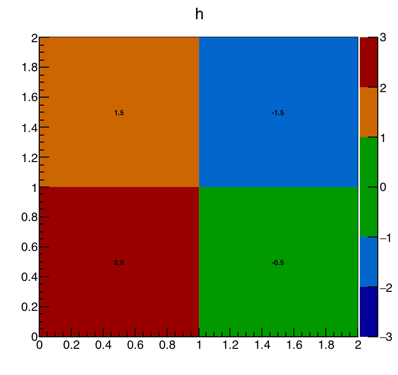
The following code works as desired ONLY if at least one value gets into the “positive saturation” range, i.e. Red:2<v:
{
    Int_t colors[6];
    colors[5] = kRed   +2;
    colors[4] = kOrange+2;
    colors[3] = kGreen +2;
    colors[2] = kGreen +2;
    colors[1] = kAzure +2;
    colors[0] = kBlue+2;
    gStyle->SetPalette(6, colors);
    gStyle->SetNumberContours(6);
    TCanvas* c = new TCanvas("c", "c", 400, 400);
    TH2F*    h = new TH2F("h", "h", 2, 0, 2, 2, 0, 2);
    h->SetStats(kFALSE);
    h->SetMaximum( 3.);
    h->SetMinimum(-3.);

    h->SetBinContent(1, 1,  2.5);
    h->SetBinContent(1, 2,  0.5);
    h->SetBinContent(2, 1, -0.5);
    h->SetBinContent(2, 2, -1.5);
    h->Draw("COLZ2");
}
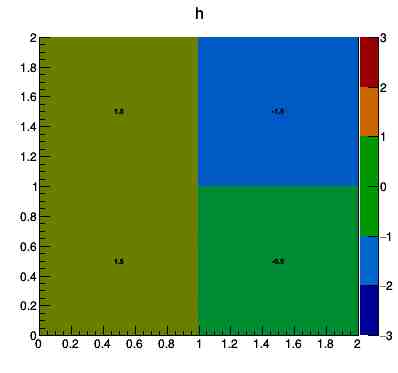
Otherwise, the desired functionality breaks, and some sort of interpolation comes into play. The following variations demonstrate that:
h->SetBinContent(1, 1, 1.5);
h->SetBinContent(1, 2, 0.5);
h->SetBinContent(2, 1, -0.5);
h->SetBinContent(2, 2, -1.5);
h->Draw("COLZ2");
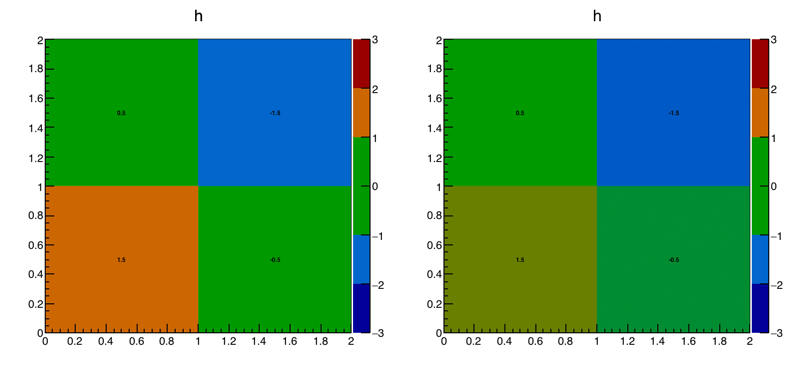
h->SetBinContent(1, 1, 1.5);
h->SetBinContent(1, 2, 0.5);
h->SetBinContent(2, 1, -0.5);
h->SetBinContent(2, 2, -2.5);
h->Draw("COLZ2");
How can I avoid that?
Thanks!