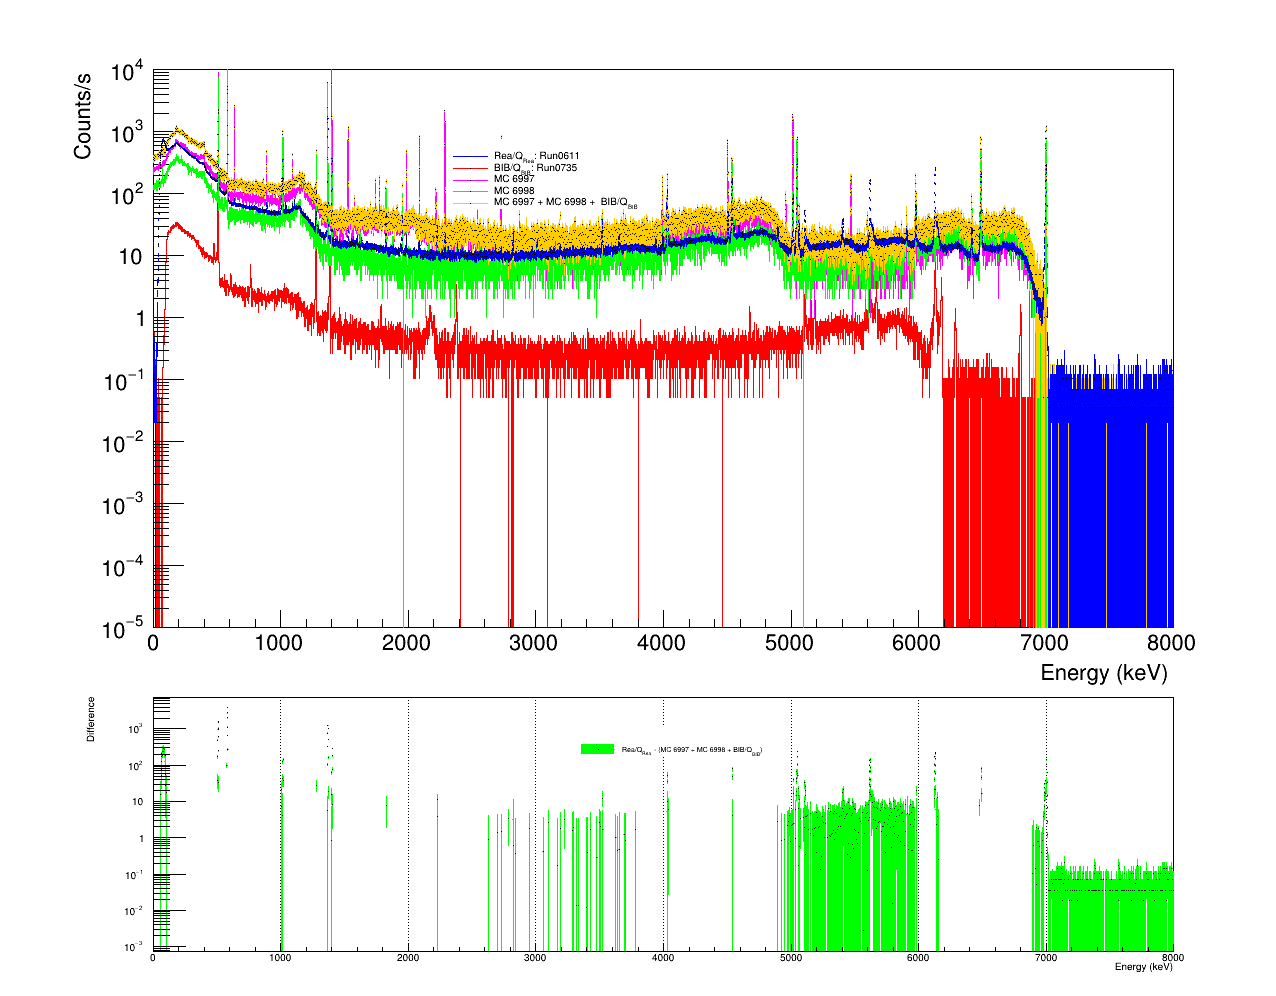
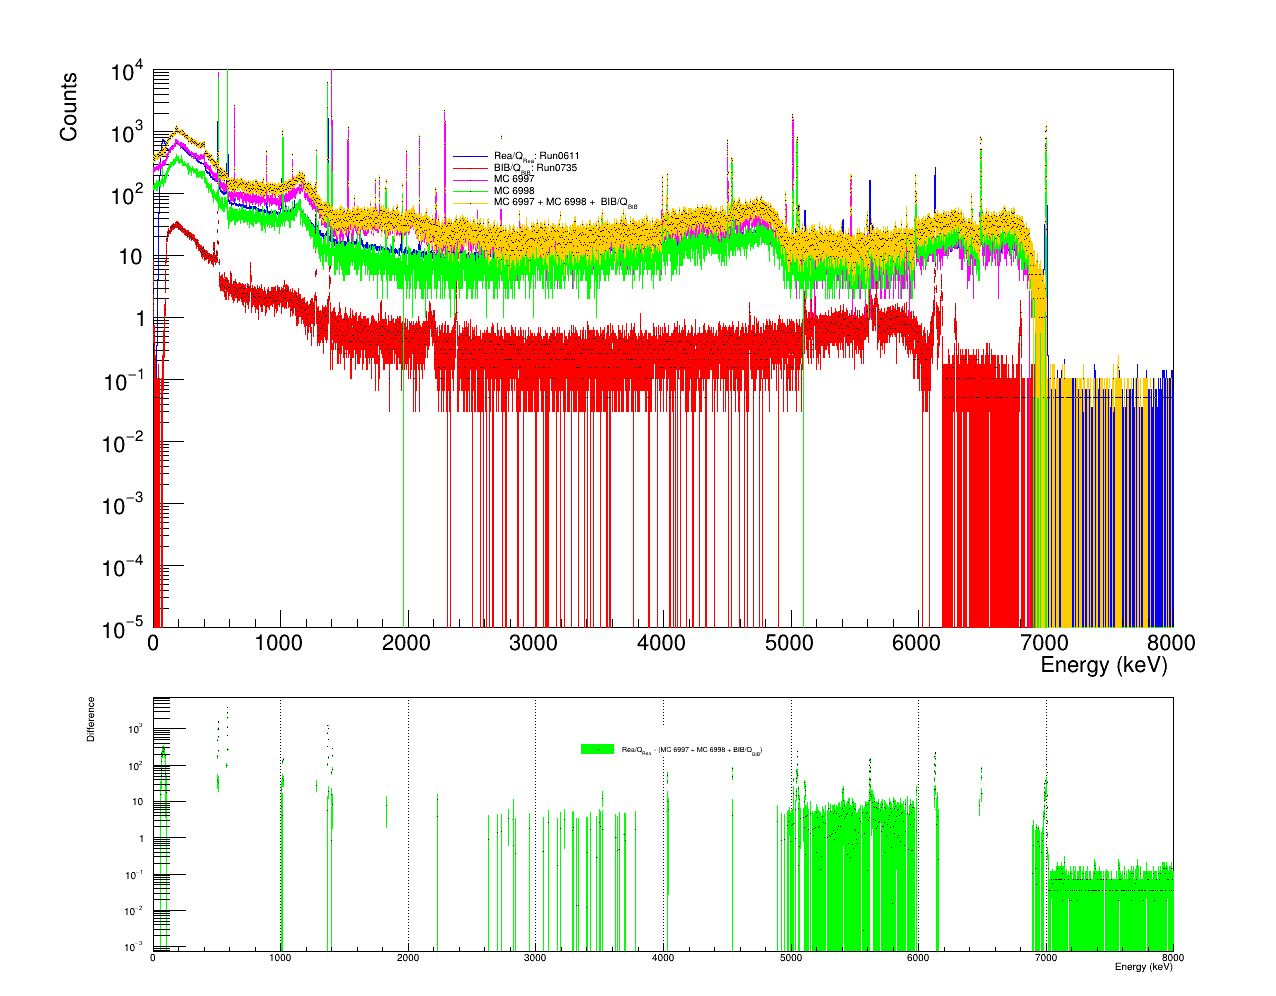
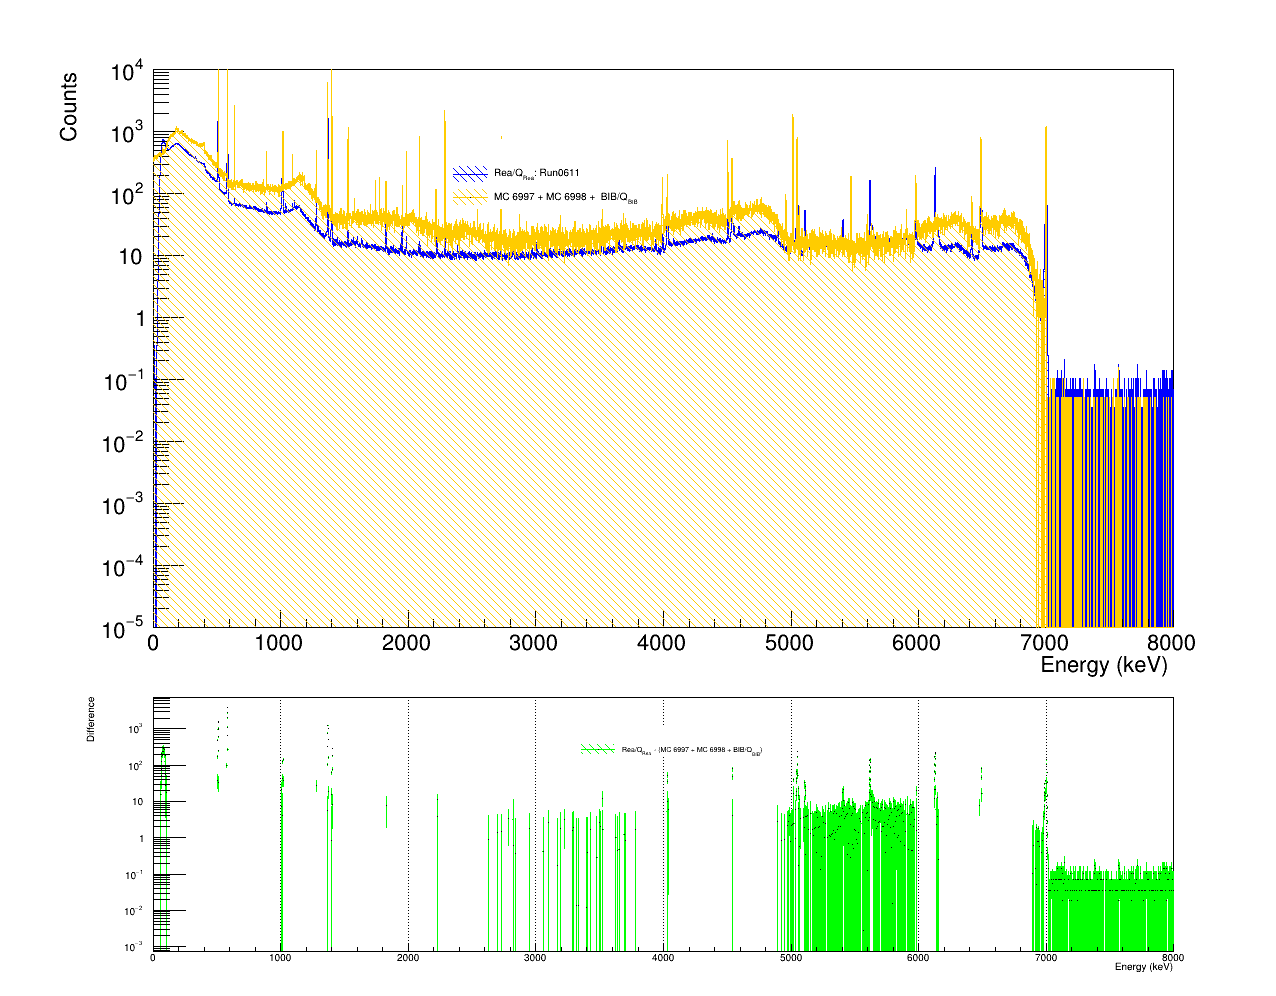
Hi, in this macro I sum the two MC simulations (6997 and 6998) and BIB to compare the sum to data reaction.
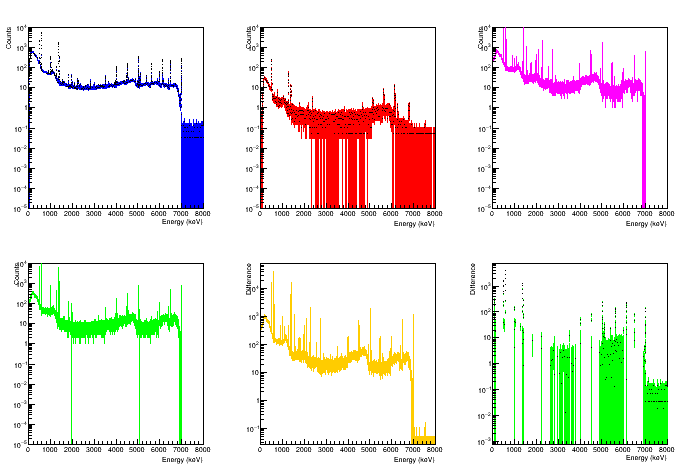
But looking the each one of the MC histograms, I see peaks that I don’t see in the sum. For example, approximately at 2300keV the MC 6997 (magenta) has a huge peack (near the legend) that isn’t present in the sum (orange).
Is my code wrong?
Ps. root files are quite large…could you check the code without the files? Otherwise I will upload them
It gets data and draws them. How just get data to sum the plot without draw partial plots?
Should I fill the TH1F without drawing?Or is there faster way?
to plot only detected events (i.e. events depositing energy in the detectors).
and
TCut cut0b = TString::Format("e2==0").Data();
to exclude signals from the pulser. Anyway, the problem is that peaks are missing when I sum the histograms. I mean, if I sum two histograms I should see the peaks in the sum…
it looks like to me that when I superimpose the plots, the peaks of the sum are not printed as line (as it happen when I plot the sum alone) but just by few points…then it’s difficult to see the peks
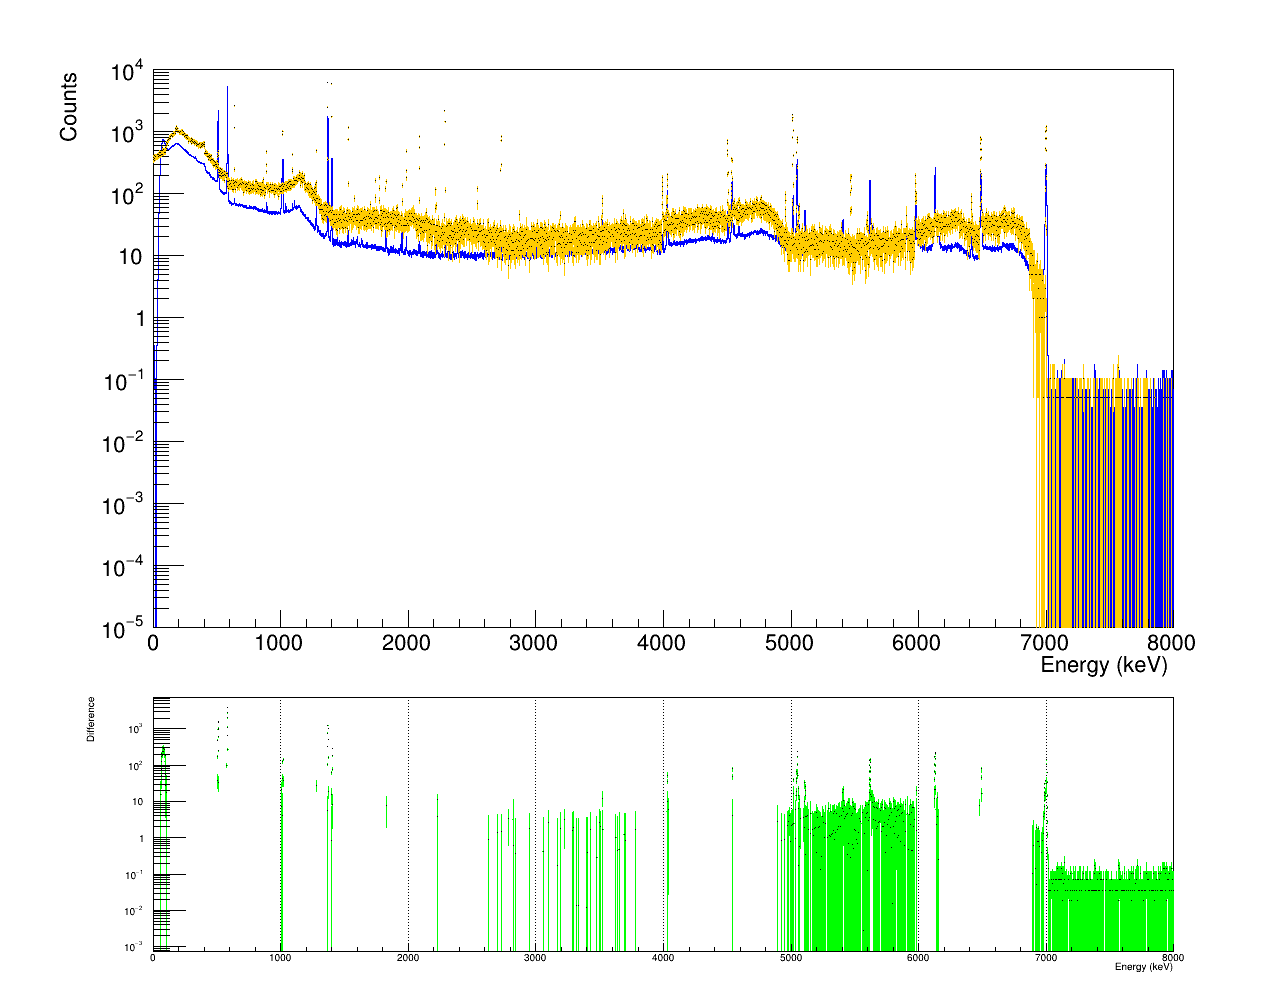
As you can see in the plot the sum histogram (orange) is a factor alpha higher than the reaction plot (blue). Then I should rescale the sum plot to have the same height of the reaction one. Ie. I should plot the sum plot as
alpha*(MC97+MC98+BIB/Q_BIB)
Is there an automatic way to get the alpha coefficient?
TCanvas *c03 = new TCanvas("c01","c01",1280,1024);
    gPad->SetLeftMargin(margl);
   	gPad->SetRightMargin(margr);
   	 TObjArray *mcbib = new TObjArray(3);        // MC and BIB histograms are put in this array
   	 mcbib->Add(hMC970);
   	 mcbib->Add(hMC980);
   	 mcbib->Add(hBIB0);
   	 TFractionFitter* fit = new TFractionFitter(hRea0, mcbib); // initialise
   fit->Constrain(1,0.0,1.0);               // constrain fraction 1 to be between 0 and 1
   fit->SetRangeX(1,15);                    // use only the first 15 bins in the fit
   Int_t status = fit->Fit();               // perform the fit
   std::cout << "fit status: " << status << std::endl;
   if (status == 0) {                       // check on fit status
     TH1F* result = (TH1F*) fit->GetPlot();
     hRea0->Draw("Ep");
     result->Draw("same");
 }
     c03->Print("Simulazione/Rea0611-MC6998-MC6997-BIB0735-Fitter_GePD.png");
but I get
**********
 **    1 **SET PRINT           0
 **********
 **********
 **    2 **SET NOGRAD
 **********
 PARAMETER DEFINITIONS:
    NO.   NAME         VALUE      STEP SIZE      LIMITS
     1 frac0        3.33333e-01  1.00000e-02     no limits
     2 frac1        3.33333e-01  1.00000e-02    0.00000e+00  1.00000e+00
     3 frac2        3.33333e-01  1.00000e-02     no limits
 **********
 **    3 **SET ERR         0.5
 **********
 **********
 **    4 **SET PRINT           0
 **********
 **********
 **    5 **SET STR           1
 **********
 **********
 **    6 **MIGRAD        1345        0.01
 **********
 MINUIT WARNING IN MIGRAD
 ============== Negative diagonal element 1 in Error Matrix
 MINUIT WARNING IN MIGRAD
 ============== 1.00339 added to diagonal of error matrix
 MINUIT WARNING IN HESSE
 ============== Negative diagonal element 1 in Error Matrix
 MINUIT WARNING IN HESSE
 ============== 115119 added to diagonal of error matrix
 MIGRAD TERMINATED WITHOUT CONVERGENCE.
 FCN=-34764.7 FROM MIGRAD    STATUS=FAILED         70 CALLS          71 TOTAL
                     EDM=1.26678e+08    STRATEGY= 1      ERR MATRIX APPROXIMATE
  EXT PARAMETER                APPROXIMATE        STEP         FIRST
  NO.   NAME      VALUE            ERROR          SIZE      DERIVATIVE
   1  frac0       -2.64959e+01   1.00066e+00  -0.00000e+00   1.59066e+04
   2  frac1        2.18605e-01   1.21803e-03   0.00000e+00   2.66754e+01
   3  frac2        7.20523e-01   2.93541e-03   0.00000e+00  -4.26068e+02
                               ERR DEF= 0.5
Warning in <TFractionFitter::Fit>: Abnormal termination of minimization.
fit status: 4
Info in <TCanvas::Print>: png file Simulazione/Rea0611-MC6998-MC6997-BIB0735-Fitter_GePD.png has been created

 *** Break *** segmentation violation