#include "RooRealVar.h"
#include "RooDataSet.h"
#include "RooGaussian.h"
#include "TCanvas.h"
#include "RooPlot.h"
#include "TAxis.h"

using namespace RooFit;

void t()
{
    TChain chain1("alp");

    auto run_N = std::to_string(2);
    auto file_1 = "/group/users/recon_lifetime/100_MeV/hadd/Signal_l_0.root";

    chain1.Add(file_1);

    ROOT::EnableImplicitMT();
    ROOT::RDataFrame df1(chain1);

//    auto df = df1.Filter("");
    auto h = df1.Histo1D({"M", "M", 200u, 0.4, 1.2}, "M");

    RooRealVar x("Mass", "Mass(GeV)", 0.4, 1.2);

    auto rdh = RooDataHist("rdh","rdh",RooArgList(x),h.GetPtr(),1.0);

    RooRealVar m1("m1", "mean1 of crystalball", 1.0, 0.4, 1.2);
    RooRealVar s1("s1", "width1 of crystalball", 0.001, 0.0, 0.01);
    RooRealVar a1("a1", "alpha1 of crystalball", 0.1, 0, 10.);
    RooRealVar n1("n1", "n1 of crystalball", 1., 0, 10.);

    RooRealVar m2("m2", "mean2 of crystalball", 0.8, 0.4, 1.2);      // Adjusted mean2 initial value
    RooRealVar s2("s2", "width2 of crystalball", 0.001, 0.0, 0.01);  // Adjusted width2 initial value
    RooRealVar a2("a2", "alpha2 of crystalball", 0.1, 0, 10.);       // Adjusted alpha2 initial value
    RooRealVar n2("n2", "n2 of crystalball", 1., 0, 10.);            // Adjusted n2 initial value

    RooCBShape cb1("cb1", "left crystalball", x, m1, s1, a1, n1);
    RooCBShape cb2("cb2", "right crystalball", x, m2, s2, a2, n2);

//    RooRealVar Nsig("Nsig", "yield of signal", 10000, 0.0,100000);
//    RooRealVar Nbkg("Nbkg", "yield of background", 10000, 0.0, 100000);

    RooRealVar Nsig("Nsig", "yield of signal", 0.0, 0.0,10000);
    RooRealVar Nbkg("Nbkg", "yield of background", 0.0, 0.0, 10000);

    RooAddPdf model("model", "", RooArgList(cb1, cb2), RooArgList(Nsig, Nbkg));

    model.fitTo(rdh,Save());

    RooFitResult* fitres = model.fitTo(rdh, RooFit::SumW2Error(true), Save());

    RooArgSet fitargs = fitres->floatParsFinal();
    TIterator* iter(fitargs.createIterator());

    for (TObject* Tobj = iter->Next(); Tobj != 0; Tobj = iter->Next()) {
        RooRealVar* rrv = dynamic_cast<RooRealVar*>(Tobj);
        std::string name = rrv->GetName();
        double val = rrv->getVal();
        double err = rrv->getError();

        printf("%s: %lf +- %lf\n", name.c_str(), val, err);
    }

    auto C = new TCanvas();
    C -> cd();
    h -> Draw();
    C -> Update();

    RooPlot* xframe = x.frame(Title("BtoK+gg Mbc"));
    rdh.plotOn(xframe);
    model.plotOn(xframe);

    model.plotOn(xframe, Components(cb1), LineColor(kGreen), LineStyle(kDotted));
    model.plotOn(xframe, Components(cb2), LineColor(kRed), LineStyle(kDashed));

    model.paramOn(xframe, Label(""), Format("NEU", AutoPrecision(1)), Layout(0.1, 0.45, 0.9), Parameters(RooArgSet(Nsig, Nbkg,m1,s1,a1,n1,m2,s2,a2,n2)));

    xframe->Draw();
    C->SaveAs("ax_100.png");
}
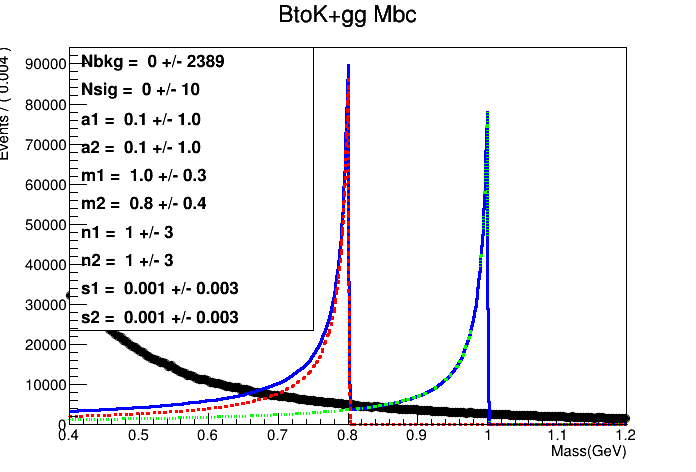
This is my code.
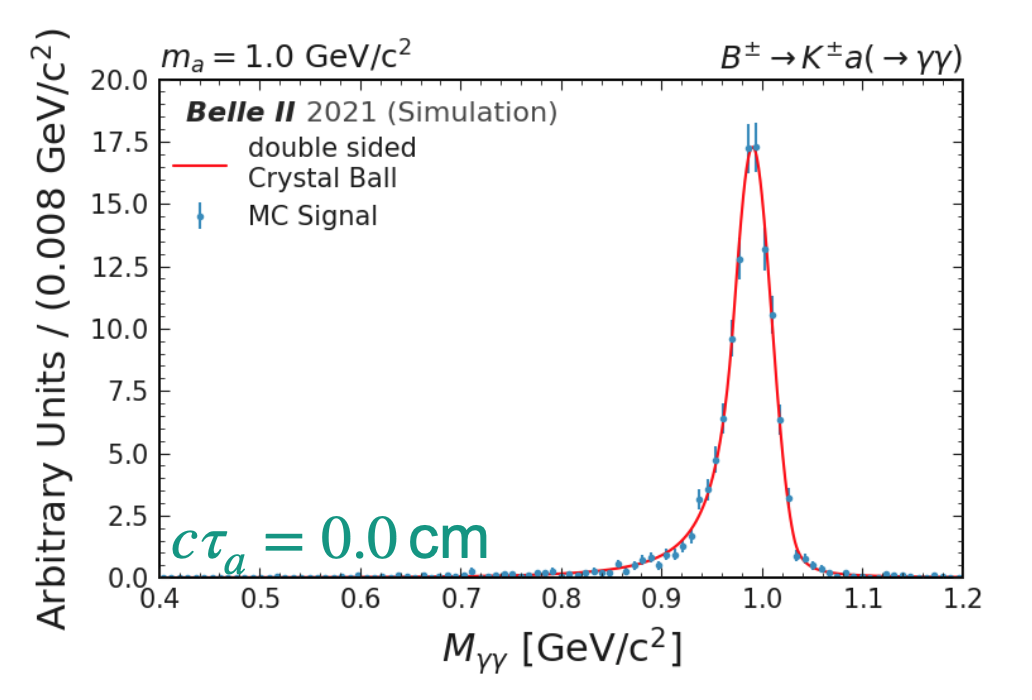
I want to form a graph like the picture shown below.
The total number of events in the file I put in as input is 100,000.
I haven’t done Double Side Crystalball fitting, and I haven’t found any examples related to it. (Can’t apply it)
Can you correct my code?
I also attach the plot that comes out when I turn my code.