  const double x[3] = {1.0, 2.0, 5.0};
  const double y[3] = {0.5, 1.0, 2.0};

  TGraph * gr = new TGraph(3, x, y);
  gr -> SetMarkerStyle(kCircle);
  TCanvas *c = new TCanvas;

  gr -> Draw("AP");
  TAxis * axis = gr -> GetXaxis();
  axis -> SetBinLabel(1, "a");
  axis -> SetBinLabel(2, "b");
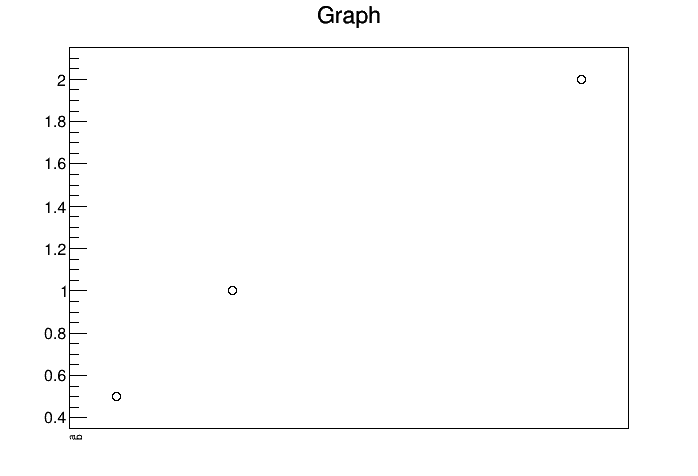
I would like to replace the numeric bin labels with alphanumeric ones: 1 → “a”, 2 → “b” (eventually also 5 → “c”). However, the result is not the one expected:
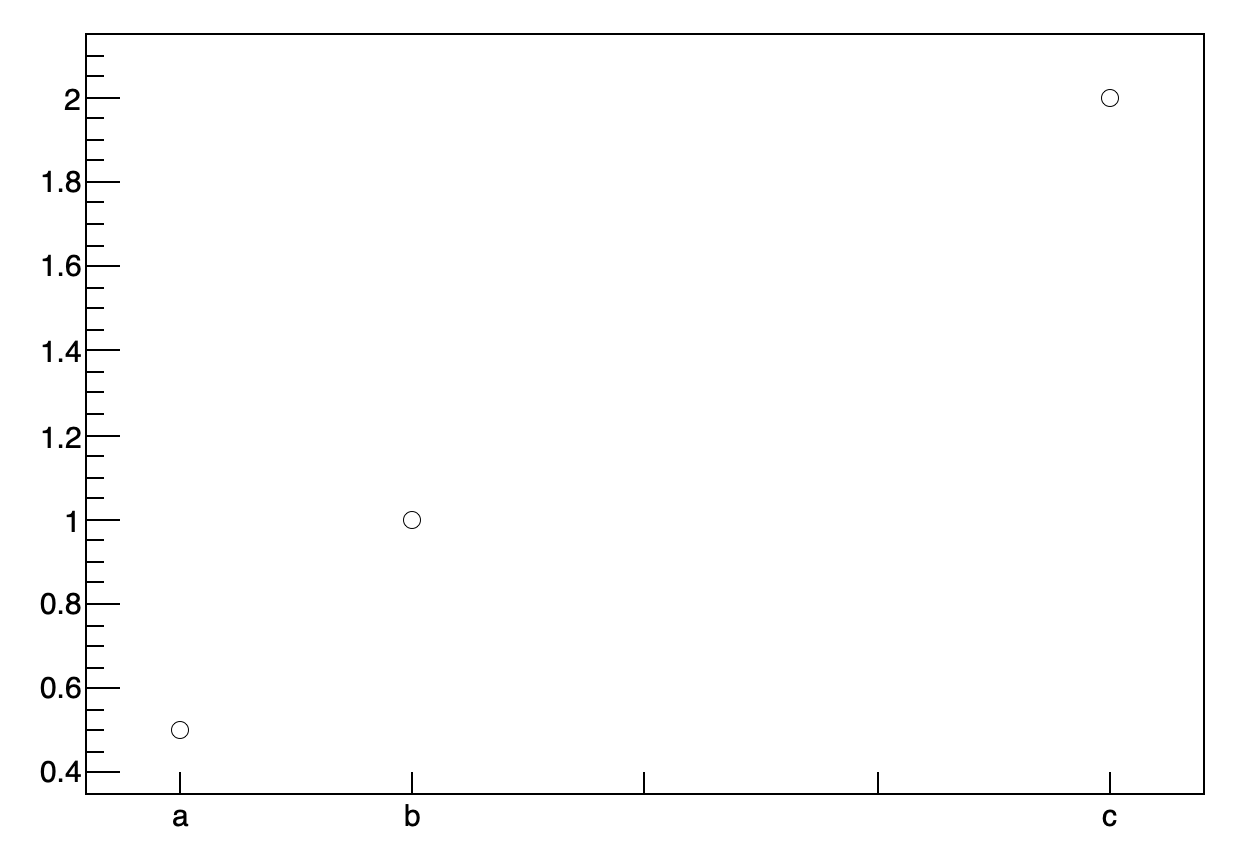
A more general approach, without guessing or figuring out the number of divisions and bins to use, can be:
{
  const int Npoints = 3;  // Number of points in the graph
  const double x[Npoints] = {1.0, 2.0, 5.0};
  const double y[Npoints] = {0.5, 1.0, 2.0};

  TGraph *gr = new TGraph(Npoints, x, y);
  gr->SetMarkerStyle(kCircle);
  TCanvas *c = new TCanvas;

  gr->Draw("AP");

  double Px, Py;  // each point in the graph
  int Nbins = gr->GetHistogram()->GetNbinsX();  // number of bins in the histogram

  for (int j=0; j<Npoints; ++j) {
    gr->GetPoint(j,Px,Py);
    for (int i=1; i<Nbins; ++i) {
      if (gr->GetHistogram()->GetBinLowEdge(i)<Px && gr->GetHistogram()->GetBinLowEdge(i+1)>Px) {
        cout  << "bin " << i << " = " << Py << endl;
        gr->GetHistogram()->GetXaxis()->SetBinLabel(i,Form("%s%d","lab_",i));
      }
    }
  }
  return;
}
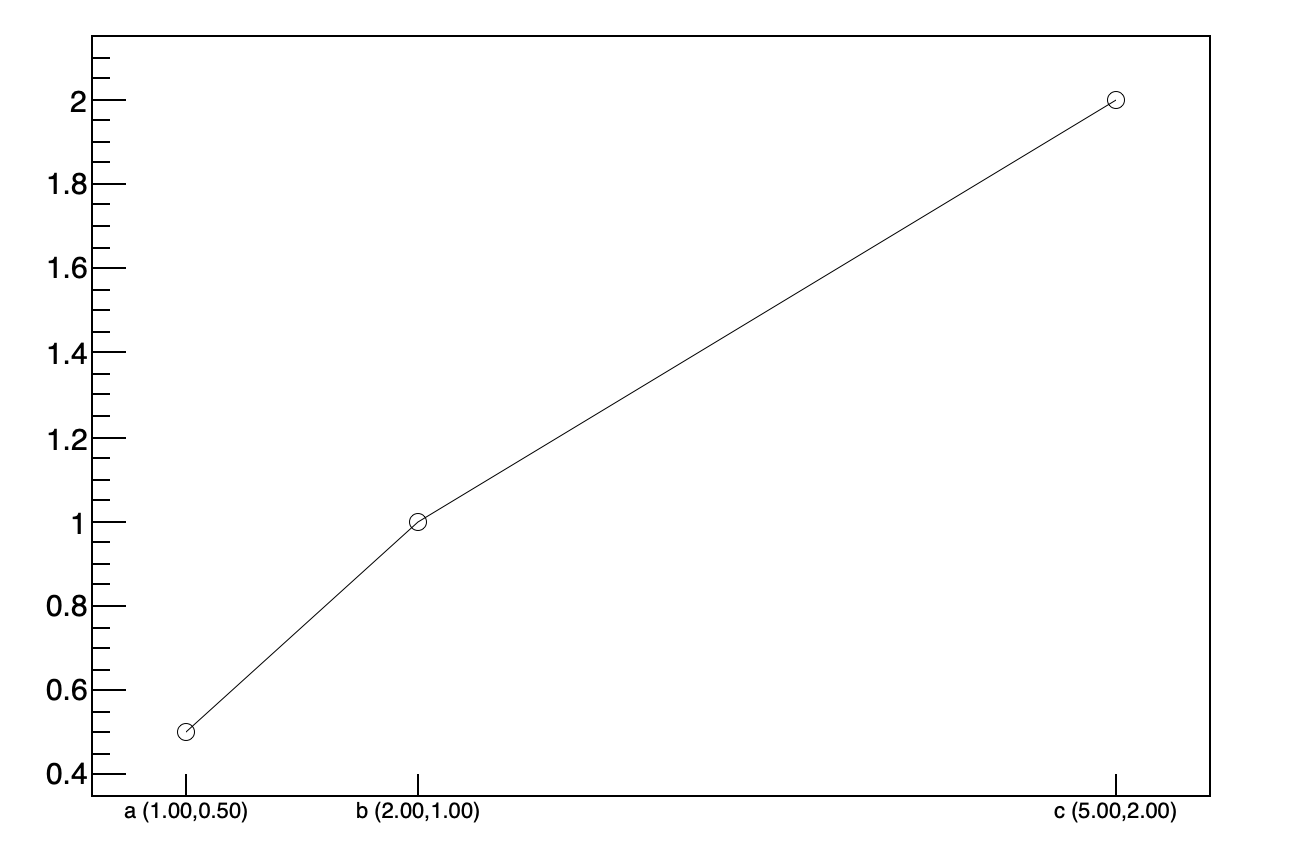
And an even more general one which allows you to move interactively the graph markers and the labels will follow. I also allows to have one tick mark per graph point whatever the points’ positions are.
const int Npoints = 3;  // Number of points in the graph
const double x[Npoints] = {1.0, 2.0, 5.0};
const double y[Npoints] = {0.5, 1.0, 2.0};
const char  *c[Npoints] = {"a","b","c"};

void graphtext3() {
   TGraph *gr = new TGraph(Npoints, x, y);
   gr->SetMarkerStyle(kCircle);
   TExec *ex = new TExec("ex","DrawText();");
   gr->GetListOfFunctions()->Add(ex);

   gr->Draw("ALP");
   gr->GetXaxis()->SetLabelSize(0);
   gr->GetXaxis()->SetTickLength(0);
}


void DrawText()
{
   Int_t i,n;
   Double_t x,y;
   TLatex *t;
   TLine *l;

   TGraph *g = (TGraph*)gPad->GetListOfPrimitives()->FindObject("Graph");
   double ymin = g->GetHistogram()->GetMinimum();
   double ymax= g->GetHistogram()->GetMaximum();
   double dy = (ymax-ymin);
   n = g->GetN();
   for (i=0; i<n; i++) {
      g->GetPoint(i,x,y);
      t = new TLatex(x, ymin-0.03*dy, Form("%s (%4.2f,%4.2f)",c[i],x,y));
      t->SetTextSize(0.025);
      t->SetTextFont(42);
      t->SetTextAlign(21);
      t->Paint();
      l = new TLine(x,ymin,x,ymin+0.03*dy);
      l->Paint();
   }
}