Hi everyone,
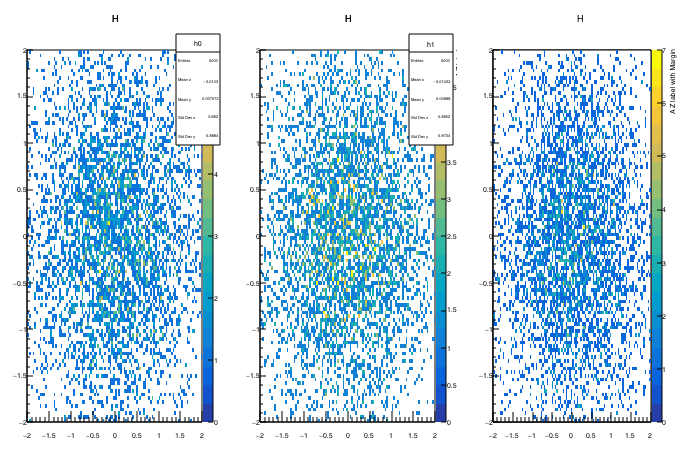
I have some issues while making some plots using “colz” option. For instance in this plot I attached, the graduation in Z axis (I mean the color bands) are
hided, so I have to use my hand once I do the plot to display it well before saving it, here is the code:
#include "TH1F.h"
#include "TPad.h"
#include "TRandom.h"
#include "Rtypes.h"

#include "AtlasLabels.h"
#include "AtlasStyle.h"
#include "AtlasUtils.h"
#include "AtlasUtils.C"
#include "AtlasLabels.C"
#include "AtlasStyle.C"

#include "TROOT.h"
#include "TObject.h"
#include "TFile.h"
#include "TTree.h"
#include "TH2.h"
#include "TMath.h"
#include "TGraph.h"
#include "TColor.h"
#include "TCanvas.h"
#include "TLegend.h"
#include <TStyle.h>
#include <iostream>
#include "TLatex.h"
#include "TProfile.h"

#include "AtlasStyle.h"

#include "TROOT.h"


void E12cmfoMtotVsM12()
{
  SetAtlasStyle();


  Int_t icol1=5;
  Int_t icol2=5;

   TCanvas* c1 = new TCanvas("c1","single inclusive jets",0,0,600,600);
  // TCanvas* c1 = new TCanvas("c1","single inclusive jets");
   c1->Divide(3,1);
   // TPad* thePad = (TPad*)c1->cd();
   // c1->SetLogz();

    TFile* f0   = new TFile("/afs/cern.ch/user/d/diboye/diboye_work/ZdZdRecoArea/run/E12cmfoMtotVsDeltaM_20_GeV.root");
   TH2D* Hist_E12VsM12_20_GeV   = (TH2D*)f0->Get("myHist_E12cmfoMtotvsDeltaM_all");
    Double_t scale1 = 1/Hist_E12VsM12_20_GeV->Integral();
    Hist_E12VsM12_20_GeV->Scale(scale1);

   TFile* f1  = new TFile("/afs/cern.ch/user/d/diboye/diboye_work/ZdZdRecoArea/run/E12cmfoMtotVsDeltaM_35_GeV.root");
   TH2D * Hist_E12VsM12_35_GeV   = (TH2D*)f1->Get("myHist_E12cmfoMtotvsDeltaM_all");
   Double_t scale2 = 1/Hist_E12VsM12_35_GeV->Integral();
    Hist_E12VsM12_35_GeV->Scale(scale2);
 TFile* f2  = new TFile("/afs/cern.ch/user/d/diboye/diboye_work/ZdZdRecoArea/run/E12cmfoMtotVsDeltaM_50_GeV.root");
  TH2D * Hist_E12VsM12_50_GeV   = (TH2D*)f2->Get("myHist_E12cmfoMtotvsDeltaM_all");
 Double_t scale3 = 1/Hist_E12VsM12_50_GeV->Integral();
    Hist_E12VsM12_50_GeV->Scale(scale3);
     gStyle->SetPalette(55);
    Hist_E12VsM12_35_GeV->SetTitle("");
    Hist_E12VsM12_35_GeV->GetXaxis()->SetTitle("#Deltam");
    Hist_E12VsM12_35_GeV->GetYaxis()->SetTitle("E12/M_{tot}");
    Hist_E12VsM12_20_GeV->SetTitle("");
    Hist_E12VsM12_20_GeV->GetXaxis()->SetTitle("#Deltam");
    Hist_E12VsM12_20_GeV->GetYaxis()->SetTitle("E12/M_{tot}");
    Hist_E12VsM12_50_GeV->SetTitle("");
    Hist_E12VsM12_50_GeV->GetXaxis()->SetTitle("#Deltam");
    Hist_E12VsM12_50_GeV->GetYaxis()->SetTitle("E12/M_{tot}");
    Hist_E12VsM12_20_GeV->SetLineColor(1);
    Hist_E12VsM12_35_GeV->SetLineColor(3);
    //  Hist_E12VsM12_35_GeV->SetMarkerStyle(20);
    Hist_E12VsM12_50_GeV->SetLineColor(2);
#ifdef __CINT__
  gROOT->LoadMacro("AtlasLabels.C");
#endif

   c1->cd(1);
  gPad->SetLogz();
 Hist_E12VsM12_20_GeV->GetYaxis()->SetRangeUser(0.49,0.55);
    Hist_E12VsM12_20_GeV->Draw("colz1");
myText(       0.60,  0.75, 1, "#sqrt{s}= 13 TeV");
 myText(       0.20,  0.75, 1, "H->ZdZd 20 GeV");
ATLASLabel(0.3,0.85,"Work In Progress");
c1->cd(2);
gPad->SetLogz();
Hist_E12VsM12_35_GeV->GetYaxis()->SetRangeUser(0.49,0.55);
      Hist_E12VsM12_35_GeV->Draw("colz");
myText(       0.60,  0.75, 1, "#sqrt{s}= 13 TeV");
myText(       0.20,  0.75, 1, "H->ZdZd 35 GeV");
ATLASLabel(0.3,0.85,"Work In Progress");
c1->cd(3);
gPad->SetLogz();
Hist_E12VsM12_50_GeV->GetYaxis()->SetRangeUser(0.49,0.55);
     Hist_E12VsM12_50_GeV->Draw("colz");
     myText(       0.20,  0.75, 1, "H->ZdZd 50 GeV");


     // TLegend* legend = new TLegend(0.2,0.7,0.4,0.75);
     //legend->SetBorderSize(0);
     //legend->AddEntry( Hist_E12VsM12_20_GeV,"H->ZdZd 20 GeV","f");
     //legend->AddEntry( Hist_E12VsM12_35_GeV,"H->ZdZd 35 GeV","f");
     //legend->AddEntry( Hist_E12VsM12_50_GeV,"H->ZdZd 50 GeV","f");
     //legend->Draw();

   myText(       0.60,  0.75, 1, "#sqrt{s}= 13 TeV");
  // myText(       0.57, 0.85, 1, "|#eta_{jet}|<0.5");
  // myMarkerText( 0.55, 0.75, 1, 3, "Data 2009",1.3);
  /*  myBoxText(    0.55, 0.67, 0.05, 1, "H->ZdZd 20 GeV");
 myBoxText(    0.55, 0.57, 0.05, 2, "H->ZdZd 50 GeV");
 myBoxText(    0.53, 0.47, 0.05, 3, "ggH bkg GeV");
 myBoxText(    0.51, 0.37, 0.05, 4, "SMZZ bkg GeV");*/
  // ATLASVersion("1.000000000");
 ATLASLabel(0.3,0.85,"Work In Progress");
  return;
}

#ifndef __CINT__
int main() {
  E12cmfoMtotVsM12();
  gPad->Print("basic.png");
  return 0;
}
#endif
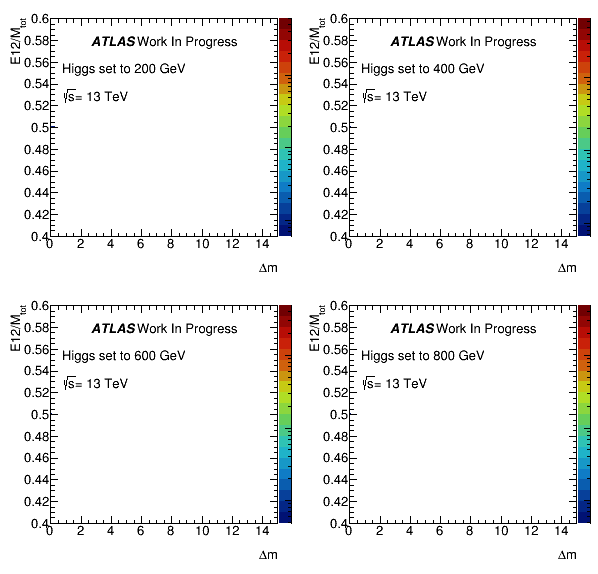
The other issue is I used almost the same code with different files but it doesn’t draw if I use a log scale on Z axis by doing this “gPad->SetLogz()” which was working well in the former code, here is the code:
#include "TH1F.h"
#include "TPad.h"
#include "TRandom.h"
#include "Rtypes.h"

#include "AtlasLabels.h"
#include "AtlasStyle.h"
#include "AtlasUtils.h"
#include "AtlasUtils.C"
#include "AtlasLabels.C"
#include "AtlasStyle.C"

#include "TROOT.h"
#include "TObject.h"
#include "TFile.h"
#include "TTree.h"
#include "TH2.h"
#include "TMath.h"
#include "TGraph.h"
#include "TColor.h"
#include "TCanvas.h"
#include "TLegend.h"
#include <TStyle.h>
#include <iostream>
#include "TLatex.h"
#include "TProfile.h"

#include "AtlasStyle.h"

#include "TROOT.h"


void E12cmfoMtotVsDeltaM200_400_600_800()
{
  SetAtlasStyle();


  Int_t icol1=5;
  Int_t icol2=5;

   TCanvas* c1 = new TCanvas("c1","single inclusive jets",0,0,600,600);
  // TCanvas* c1 = new TCanvas("c1","single inclusive jets");
  // TPad* thePad = (TPad*)c1->cd();
  // thePad->SetLogz();
   c1->Divide(2,2);


    TFile* f0   = new TFile("/afs/cern.ch/user/d/diboye/diboye_work/ZdZdTruthArea/run/Plots/E12cmfoMtotVsDeltaM_200_GeV.root");
   TH2D* Hist_E12VsM12_200_GeV   = (TH2D*)f0->Get("myHist_E12cmfoMtotvsDeltaM_all");
 Double_t scale1 = 1/Hist_E12VsM12_200_GeV->Integral();
    Hist_E12VsM12_200_GeV->Scale(scale1);
    TFile* f1  = new TFile("/afs/cern.ch/user/d/diboye/diboye_work/ZdZdTruthArea/run/Plots/E12cmfoMtotVsDeltaM_400_GeV.root");
   TH2D * Hist_E12VsM12_400_GeV   = (TH2D*)f1->Get("myHist_E12cmfoMtotvsDeltaM_all");
Double_t scale2 = 1/Hist_E12VsM12_400_GeV->Integral();
    Hist_E12VsM12_400_GeV->Scale(scale2);
 TFile* f2  = new TFile("/afs/cern.ch/user/d/diboye/diboye_work/ZdZdTruthArea/run/Plots/E12cmfoMtotVsDeltaM_600_GeV.root");
   TH2D * Hist_E12VsM12_600_GeV   = (TH2D*)f2->Get("myHist_E12cmfoMtotvsDeltaM_all");
Double_t scale3 = 1/Hist_E12VsM12_600_GeV->Integral();
Hist_E12VsM12_600_GeV->Scale(scale3);
 TFile* f3  = new TFile("/afs/cern.ch/user/d/diboye/diboye_work/ZdZdTruthArea/run/Plots/E12cmfoMtotVsDeltaM_800_GeV.root");
 TH2D * Hist_E12VsM12_800_GeV   = (TH2D*)f3->Get("myHist_E12cmfoMtotvsDeltaM_all");
Double_t scale4 = 1/Hist_E12VsM12_800_GeV->Integral();
Hist_E12VsM12_800_GeV->Scale(scale4);


 gStyle->SetPalette(55);
    Hist_E12VsM12_800_GeV->SetTitle("");
    Hist_E12VsM12_800_GeV->GetXaxis()->SetTitle("#Deltam");
    Hist_E12VsM12_800_GeV->GetYaxis()->SetTitle("E12/M_{tot}");

    Hist_E12VsM12_600_GeV->SetTitle("");
    Hist_E12VsM12_600_GeV->GetXaxis()->SetTitle("#Deltam");
    Hist_E12VsM12_600_GeV->GetYaxis()->SetTitle("E12/M_{tot}");

    Hist_E12VsM12_400_GeV->SetTitle("");
    Hist_E12VsM12_400_GeV->GetXaxis()->SetTitle("#Deltam");
    Hist_E12VsM12_400_GeV->GetYaxis()->SetTitle("E12/M_{tot}");

    Hist_E12VsM12_200_GeV->SetTitle("");
    Hist_E12VsM12_200_GeV->GetXaxis()->SetTitle("#Deltam");
    Hist_E12VsM12_200_GeV->GetYaxis()->SetTitle("E12/M_{tot}");


     Hist_E12VsM12_200_GeV->SetLineColor(1);
     Hist_E12VsM12_400_GeV->SetLineColor(2);
     Hist_E12VsM12_600_GeV->SetLineColor(3);
     Hist_E12VsM12_800_GeV->SetLineColor(4);
#ifdef __CINT__
  gROOT->LoadMacro("AtlasLabels.C");
#endif

    c1->cd(1);

    gPad->SetLogz();
   Hist_E12VsM12_200_GeV->Draw("colz");

      myText(       0.20,  0.65, 1, "#sqrt{s}= 13 TeV");
     myText(       0.20,  0.75, 1, "Higgs set to 200 GeV");
     ATLASLabel(0.3,0.85,"Work In Progress");
      c1->cd(2);
       gPad->SetLogz();
 Hist_E12VsM12_400_GeV->Draw("colz");
        myText(       0.20,  0.65, 1, "#sqrt{s}= 13 TeV");
     myText(       0.20,  0.75, 1, "Higgs set to 400 GeV");
     ATLASLabel(0.3,0.85,"Work In Progress");


 c1->cd(3);
  gPad->SetLogz();
  Hist_E12VsM12_600_GeV->Draw("colz");
        myText(       0.20,  0.65, 1, "#sqrt{s}= 13 TeV");
     myText(       0.20,  0.75, 1, "Higgs set to 600 GeV");
     ATLASLabel(0.3,0.85,"Work In Progress");


 c1->cd(4);
  gPad->SetLogz();
 Hist_E12VsM12_800_GeV->Draw("colz");
     myText(       0.20,  0.65, 1, "#sqrt{s}= 13 TeV");
     myText(       0.20,  0.75, 1, "Higgs set to 800 GeV ");
     ATLASLabel(0.3,0.85,"Work In Progress");


  //TLegend* legend = new TLegend(0.2,0.7,0.4,0.75);
  // legend->SetBorderSize(0);
  // legend->AddEntry( Hist_E12VsM12_200_GeV,"Higgs set 200 GeV","f");
  //legend->AddEntry( Hist_E12VsM12_400_GeV,"Higgs set 400 GeV","f");
  //legend->AddEntry( Hist_E12VsM12_600_GeV,"Higgs set 600 GeV","f");
  //legend->AddEntry( Hist_E12VsM12_800_GeV,"Higgs set 800 GeV","f");
  // legend->Draw();

  // myText(       0.57,  0.75, 1, "#sqrt{s}= 13 TeV");
  // myText(       0.57, 0.85, 1, "|#eta_{jet}|<0.5");
  // myMarkerText( 0.55, 0.75, 1, 3, "Data 2009",1.3);
  /*  myBoxText(    0.55, 0.67, 0.05, 1, "H->ZdZd 20 GeV");
 myBoxText(    0.55, 0.57, 0.05, 2, "H->ZdZd 50 GeV");
 myBoxText(    0.53, 0.47, 0.05, 3, "ggH bkg GeV");
 myBoxText(    0.51, 0.37, 0.05, 4, "SMZZ bkg GeV");*/
  // ATLASVersion("1.000000000");
     // ATLASLabel(0.3,0.85,"Work In Progress");
  return;
}

#ifndef __CINT__
int main() {
  E12cmfoMtotVsDeltaM200_400_600_800();
  gPad->Print("basic.png");
  return 0;
}
#endif
I would appreciate if someone could help.
Cheers