ROOT Version: 6.14.00
Platform: Ubuntu 18.04.1 LTS
Compiler: Not Provided
Hello,
I try to create a macro in which 4 graphs with error bars are displayed. This is what I have tried:
//Macro to do 4 graphics of amplitude vs voltage
void Am_Vol_4placas()
{
   TCanvas *c1 = new TCanvas("c1","Amplitude vs Voltage");
   c1->SetGrid();

   // draw a frame to define the range
   TH1F *hr = c1->DrawFrame(8,0,140,16);
   hr->SetXTitle("Xtitulo");
   hr->SetYTitle("ytitulo");
   c1->GetFrame()->SetBorderSize(12);


   // First plot 3 mm
   const Int_t n1 = 6;
   Double_t x1[]  = {10,11,12,13,14,15};
   Double_t y1[]  = {98.614,108.648,112.112,104.708,124.092,123.301};
   Double_t ex1[] = {0,0,0,0,0,0,};
   Double_t ey1[] = {9.8,10.86,11.21,10.47,12.40,12.33};
   TGraphErrors *gr1 = new TGraphErrors(n1,x1,y1,ex1,ey1);
   gr1->SetMarkerColor(kBlue);
   gr1->SetMarkerStyle(21);
   gr1->Draw("AP");

   // second plot 4.7 mm
   const Int_t n2 = 6;
   Float_t x2[]  = {8,9,10,11,12,13};
   Float_t y2[]  = {107.04,114.9,115.548,112.786,120.112,122.36};
   Float_t ex2[] = {0,0,0,0,0,0,};
   Float_t ey2[] = {10.7,11.4,11.5,11.2,12,12.2};
   TGraphErrors *gr2 = new TGraphErrors(n2,x2,y2,ex2,ey2);
   gr2->SetMarkerColor(kRed);
   gr2->SetMarkerStyle(21);
   gr2->Draw("AP");

   //third plot 2 mm
    const Int_t n3 = 6;
   Float_t x3[] = {9,10,11,12,13,14};
   Float_t y3[] = {102.77,108.61,109.92,116.62,121.37,121.47};
   Float_t ex3[] = {0,0,0,0,0,0};
   Float_t ey3[] = {10.2,10.8,10.9,11.6,12.13,12.14};
   TGraphErrors *gr3 = new TGraphErrors(n3,x3,y3,ex3,ey3);
   gr3->SetMarkerColor(kYellow);
   gr3->SetMarkerStyle(21);
   gr3->Draw("AP");

   //fourth plot 1.2
   const Int_t n4 = 6;
   Float_t x4[] = {9,10,11,12,13,14};
   Float_t y4[] = {106.56,104.46,112.93,118.21,119.56,126.19};
   Float_t ex4[] = {0,0,0,0,0,0};
   Float_t ey4[] = {10.65,10.44,11.29,11.82,11.95,12.61};
   TGraphErrors *gr4 = new TGraphErrors(n4,x4,y4,ex4,ey4);
   gr4->SetMarkerColor(kGreen);
   gr4->SetMarkerStyle(21);
   gr4->Draw("AP");


   //create legenda
   auto legend = new TLegend(0.1,0.7,0.48,0.9);
   legend->SetHeader("Aluminium plates","C");
   legend->AddEntry(gr1,"3mm","lep");
   legend->AddEntry(gr2,"4.7mm","lep");
   legend->AddEntry(gr3,"1.2mm","lep");
   legend->AddEntry(gr4,"2mm","lep");
   legend->Draw();

}
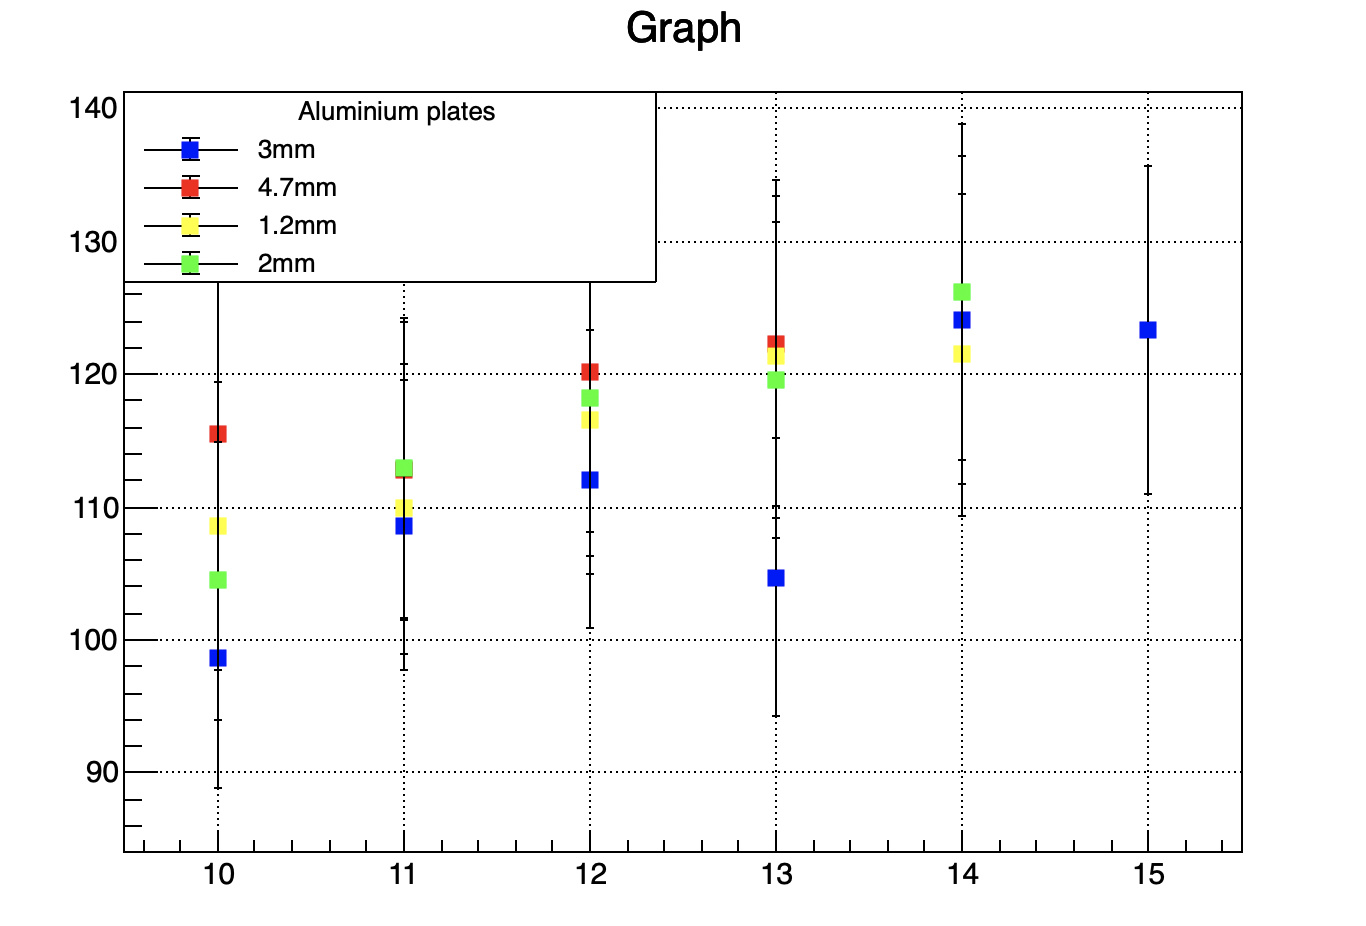
This is what I get:

How can I fix this in order of see the points of the 4 colors corresponding to the 4 different graphics?
Thanks in advance.
Kind regards