Difficult in adjusting the error ratio in TGraphErrors

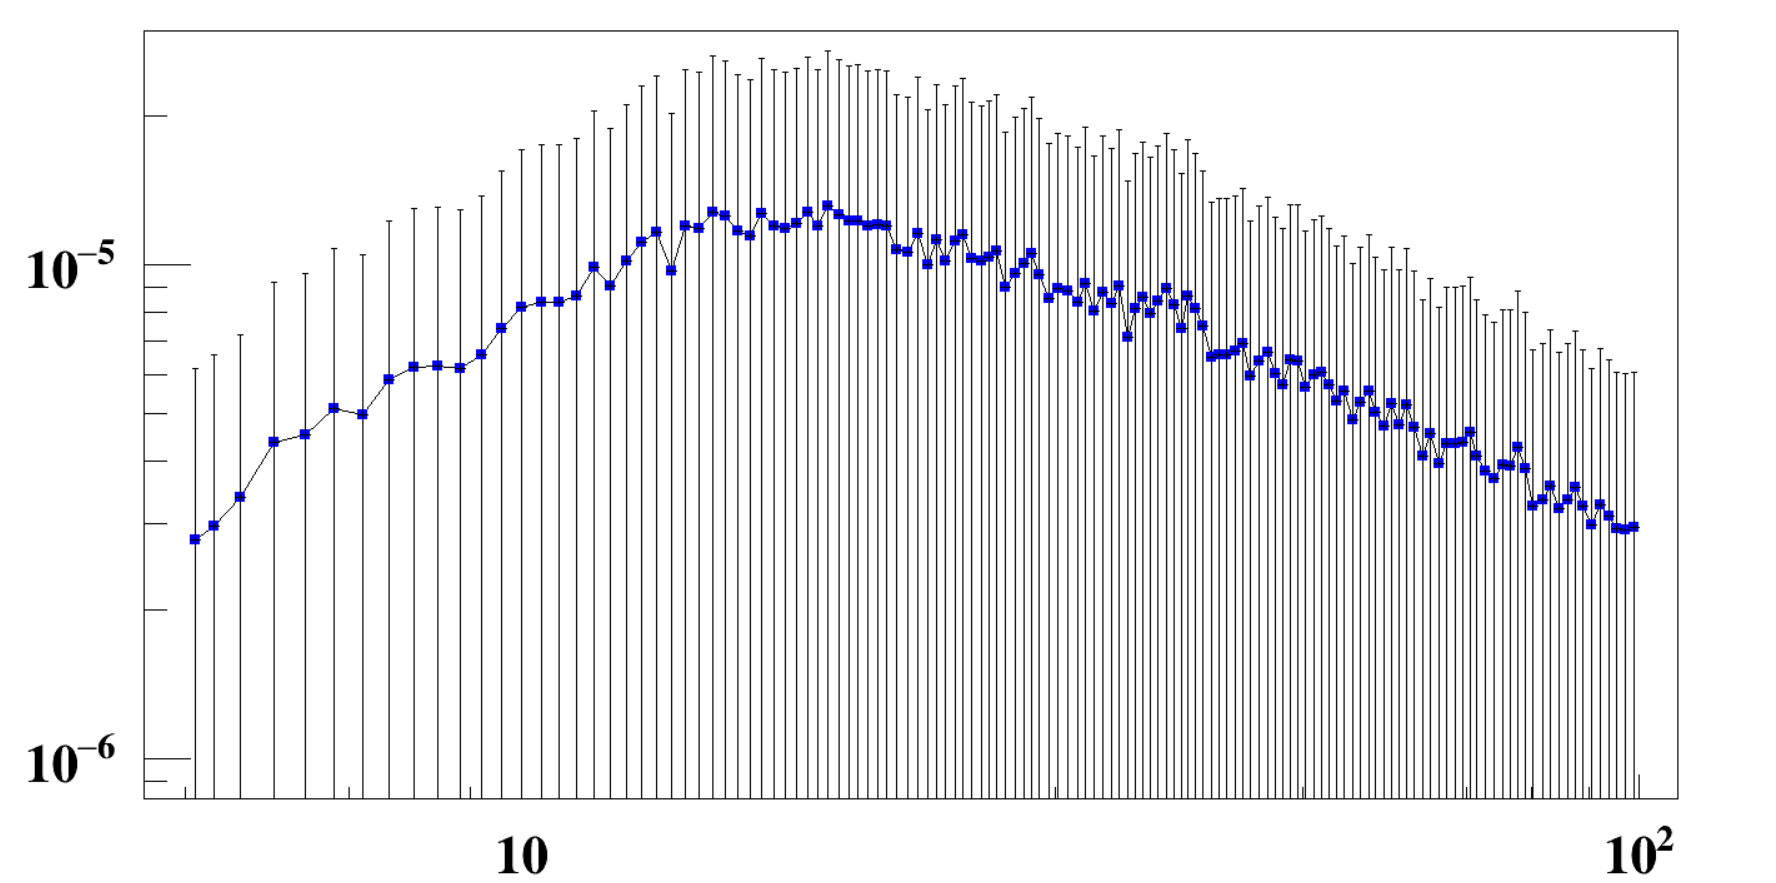
In the TGraphErrors class, my vertical coordinate errors are quite large, almost comparable to the values of the vertical coordinate, while the horizontal coordinate errors are very small and barely noticeable, differing by about six orders of magnitude. Is there any way to adjust the scale to make the graph look better?

Here is an example of a graph with unadjusted errors in TGraphErrors:

I would like to achieve the following effects:

I guess it is just because you created the TGraphErrors with such values.
Can we have a small example reproducing this effect ?

Yes, the values are indeed set like that, and I’m looking to enhance the visual appearance of the graph from a design perspective.
xdata like this:

 5.0990
 5.2991
 5.5964
 5.9967
 6.3969
 6.7971
 7.1972
 7.5974
 7.9975
 8.3976

ydata like this:

2.775041e-06
2.959593e-06
3.377042e-06
4.359748e-06
4.533188e-06
5.129545e-06
4.972180e-06
5.845454e-06
6.199621e-06
6.230194e-06

xerrordata like this:

2.148473e-06
2.320025e-06
2.904304e-06
3.841128e-06
4.007863e-06
4.579205e-06
4.429680e-06
5.267484e-06
5.608586e-06
5.638872e-06

yerrordata like this:

3.401610e-06
3.599161e-06
3.849780e-06
4.878368e-06
5.058514e-06
5.679885e-06
5.514680e-06
6.423424e-06
6.790657e-06
6.821517e-06

TGraphErrors just draw what you set. It is up to you to decide what would "best looking"value for the errors. That’s your choice, ROOT cannot do that for you.

okay,thanks for your reply!

This topic was automatically closed 14 days after the last reply. New replies are no longer allowed.