kihjos
November 2, 2019, 8:53pm
1
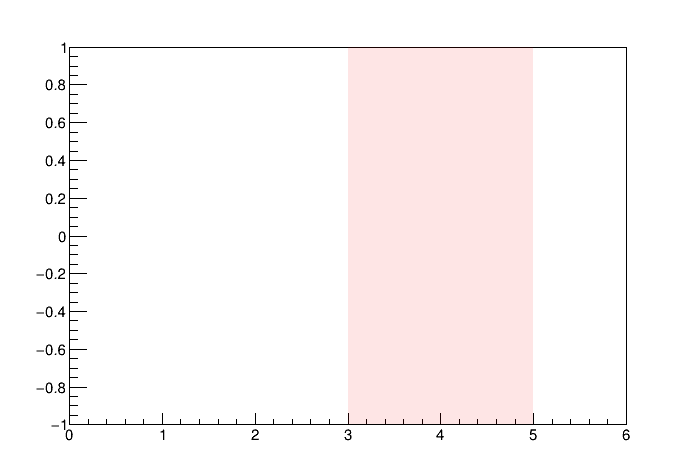
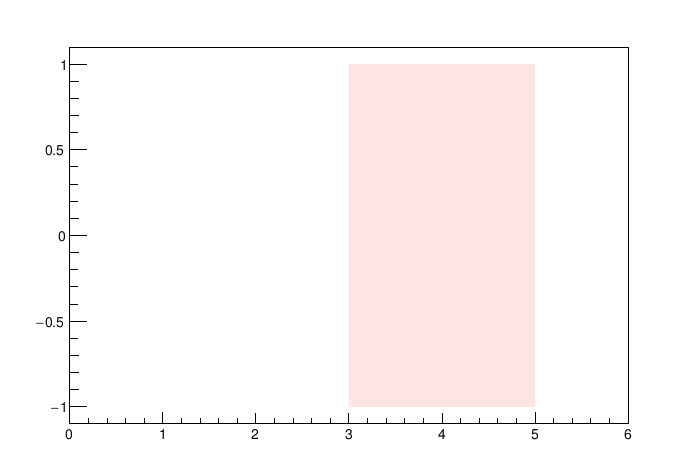
The following code gives the first image below when run as given, but when I comment out the ROOT.gROOT.SetBatch(True) line it gives the second image below. As seen, they have different y-axis ranges. Is this something that happens not just for me, and is it considered a bug? I hoped to get the same results when running in batch mode or not (usually it works like that, not in this case for me).
import ROOT

ROOT.gStyle.SetCanvasPreferGL(True)
ROOT.gROOT.SetBatch(True)

graphs = ROOT.TMultiGraph()
canvas = ROOT.TCanvas()

graph = ROOT.TGraphAsymmErrors()
graph.SetFillColorAlpha(ROOT.kRed, 0.1)
graph.SetFillStyle(1001)
graph.SetPoint(0,3,1)
graph.SetPointError(0,0,0,2,0)
graph.SetPoint(1,5,1)
graph.SetPointError(1,0,0,2,0)

graphs.Add(graph, "3")

graphs.Draw("A")
graphs.GetXaxis().SetLimits(0, 6)

canvas.Modified()
canvas.Update()
canvas.SaveAs("test.png")
ROOT Version: 6.19.01
Hi,
again I invite @couet to help here.
couet
November 4, 2019, 9:03am
3
I see it is connected to the fact you do SetCanvasPreferGL();
{
///   gStyle->SetCanvasPreferGL(kTRUE);
   gROOT->SetBatch(kTRUE);

   auto graphs = new TMultiGraph();
   auto canvas = new TCanvas();

   auto graph = new TGraphAsymmErrors();
   graph->SetFillColorAlpha(kRed, 0.1);
   graph->SetFillStyle(1001);
   graph->SetPoint(0,3,1);
   graph->SetPointError(0,0,0,2,0);
   graph->SetPoint(1,5,1);
   graph->SetPointError(1,0,0,2,0);

   graphs->Add(graph, "3");

   graphs->Draw("A");
   graphs->GetXaxis()->SetLimits(0, 6);

   canvas->Modified();
   canvas->Update();
   canvas->SaveAs("c1.png");
}
kihjos
November 4, 2019, 4:17pm
4
To set the opaqueness of the color using SetFillColorAlpha() I believe it is needed.
couet
November 5, 2019, 10:20am
5
Ah ok. Yes on some machines. PDF has it on all machines.SetCanvasPreferGL() is on.
system
November 19, 2019, 10:20am
6
This topic was automatically closed 14 days after the last reply. New replies are no longer allowed.