Hello,
I have currently a strange problem. When I type these commands
[quote]root -l RUN133.root
root [0]
Attaching file RUN133.root as _file0…
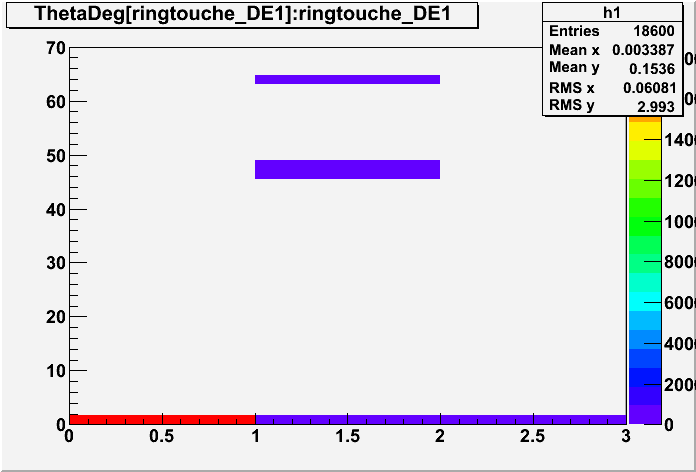
root [1] t->Draw(“ThetaDeg[ringtouche_DE1]:ringtouche_DE1>>h1”,"",“colz”)
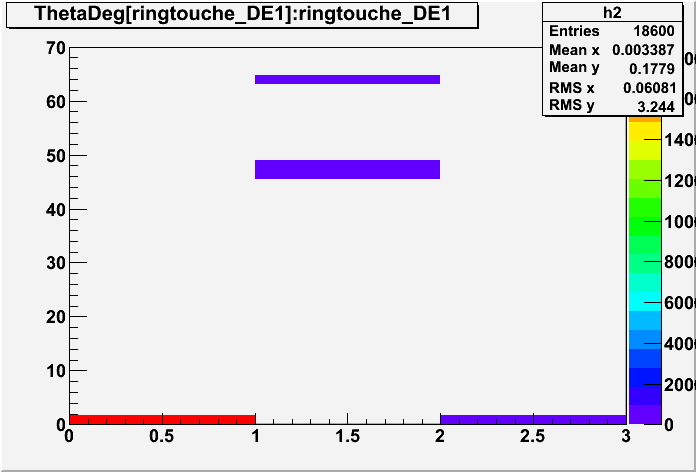
root [2] t->Draw(“ThetaDeg[ringtouche_DE1]:ringtouche_DE1>>h2”,"",“colz”)[/quote]
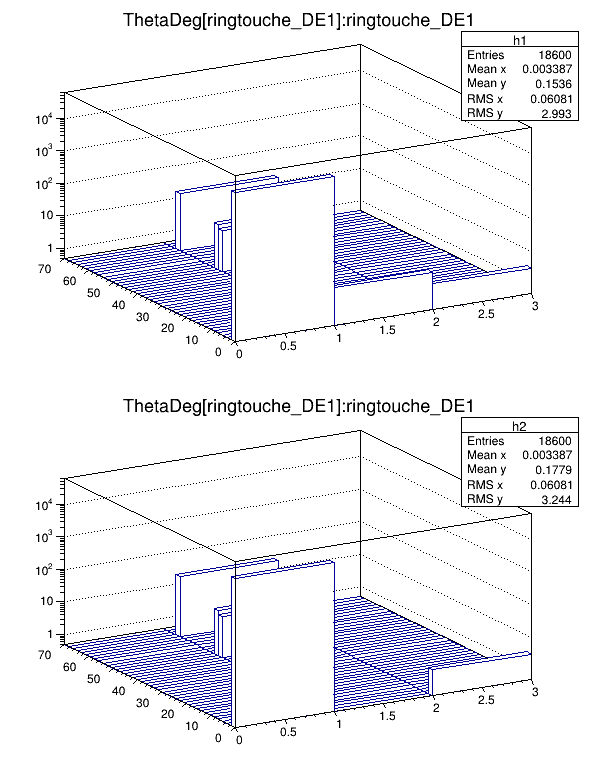
I got two different plots (disappearance of the bin at (1,0) in h2). The second plot (h2) is not drastically different from the first one (h1) but it is. In my opinion, it should not be the case since I am plotting exactly the same. If I type one more time the same command, I get the same histo as h2 (it does not evolve anymore). Moreover the integrals of both histo is exactly the same (but not GetMean(2) and GetRMS(2)). So I guess it is just a graphical bug.
The two Draw calls produce a different list of entries
import ROOT as r
import numpy as np

f = r.TFile('RUN133.root')

# I draw only the y variable here were the histograms where visibly different
f.t.Draw('ThetaDeg[ringtouche_DE1]:ringtouche_DE1>>h1')
t1 = np.array([f.t.GetV1()[i] for i in range(f.t.GetSelectedRows())])

f.t.Draw('ThetaDeg[ringtouche_DE1]:ringtouche_DE1>>h1')
t2 = np.array([f.t.GetV1()[i] for i in range(f.t.GetSelectedRows())])

# show entries which are different
print filter(lambda x: x[0]!=x[1], zip(t1, t2))
It would be nice to have that fixed and also to hear some words on why and when this happens. I would like to make sure I understand any data loss in unfixed ROOT versions.
There is two related problem. First the command:t->Draw("ThetaDeg[ringtouche_DE1]:ringtouche_DE1>>h1","","colz") is very unlikely to be what you meant to get. The branch is defined as:*Br 42 :ThetaDeg : thetaDeg[ringtouche_DE1]/F *i.e. an array with exact ‘ringtouche_DE1’ elements whose index range is 0 to … ringtouche_DE1 exclusive. The second problem is that there was a missing protection in this case of out of bound access. The result was random rather than being all zeros.
You might have meant either:t->Draw("ThetaDeg:ringtouche_DE1>>h1","","colz")to plot all the values of ThetaDeg vs ringtouche_DE1[/code]or you may have meant
Cheers,
Philippe.
PS. The missing protection has now been added to the repository.