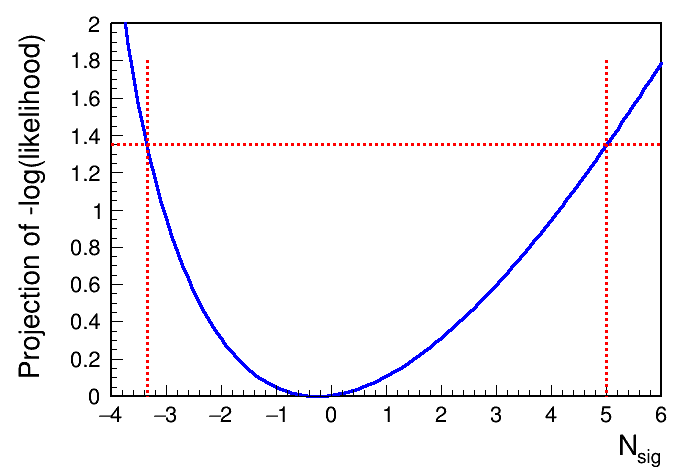
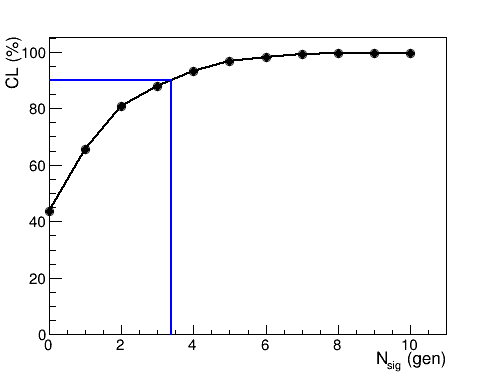
I want to set 90% CL upper limits on the signal yield (Nsig). I have done this using two methods, the profile likelihood projection and the frequentist approach. The plots for them are attached herewith;
I would expect similar Nsig(UL) since the same PDF is used for both methods. But from the likelihood method, the Nsig(UL) is ~5, while from the frequentist approach, it’s ~3.8. What could be the reason for this difference?
Probably the difference in the two method is that your N_{sig} for profile likelihood is allowed to have negative value. If you force N_{sig} to be larger or equal to zero, the profile likelihood distribution will change shape.
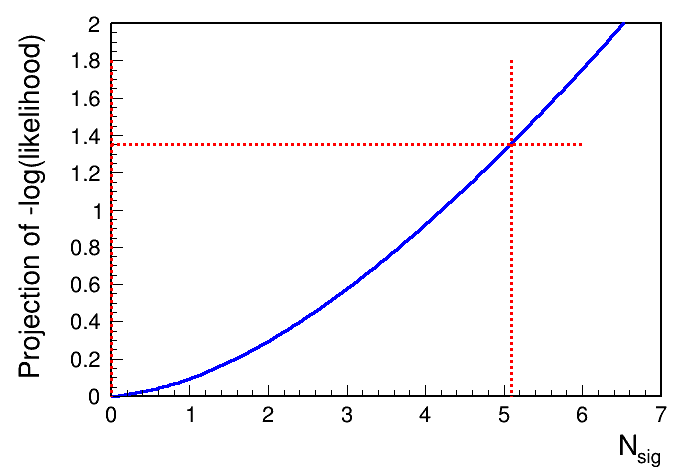
Thank you for your response. Herewith I have attached the profile likelihood plot confining Nsig to be positive, but still, the Nsig(UL) is quite different from the frequentist approach.
What us the pdf you have for Nsig? Are you also having systematic uncertainties that re profiled in the calculation of the upper limit?
It is true the result is strange, I would eventually expect a larger upper limit for the frequentist method, than the asymptotic one based on th profile likelihood.