Difference creating pdf and png

Dear ROOT experts

when creating png and pdf output, the results look different as shown in the attachment.
Is there anything I am doing wrong using the command:

canvas->Print(/Library/WebServer/Documents/NewTMDplotter/public/2c269bad713303357674.pdf, “pdf”);
canvas->Print(/Library/WebServer/Documents/NewTMDplotter/public/2c269bad713303357674.png, “png”);

Thanks a lot
Best
Hannes

I am using:
ROOT Version: 6.22/08
Built for macosx64 on Mar 10 2021, 14:20:04
From tags/v6-22-08@v6-22-08
2c269bad713303357674.pdf (17.2 KB)

Maybe try this:

canvas->Print("/path/to/file.png");

I am not sure as to why this is happening, but this is the syntax I use for exporting. Perhaps this will solve the error. @couet any idea?

Thanks a lot, but unfortunately it does not help, the result is the same.
Cheers
Hannes

These blue triangles on the png output are really weird.
Can you provide the macro producing this problem ?

Hm, it is after a lengthy calculation, would it make sense to produce a txt file ?
Or how could I share it (I can also put the full code somewhere on a public place at CERN).
Thanks a lot
Cheers
Hannes

You can also save the canvas as a .root file and post it here.

Hm, this is really weird.
I did the following:
canvas->Print(test.root);
canvas->Print(test.png);
canvas->Print(test.pdf);

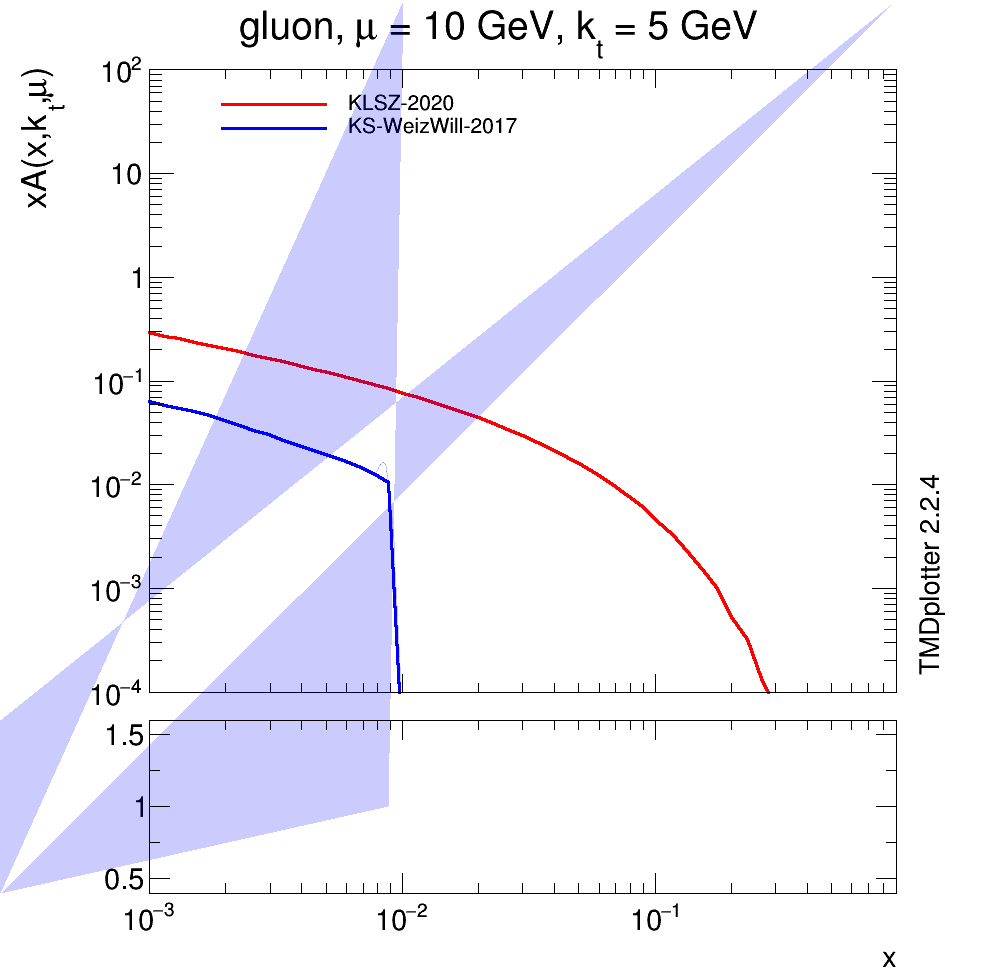
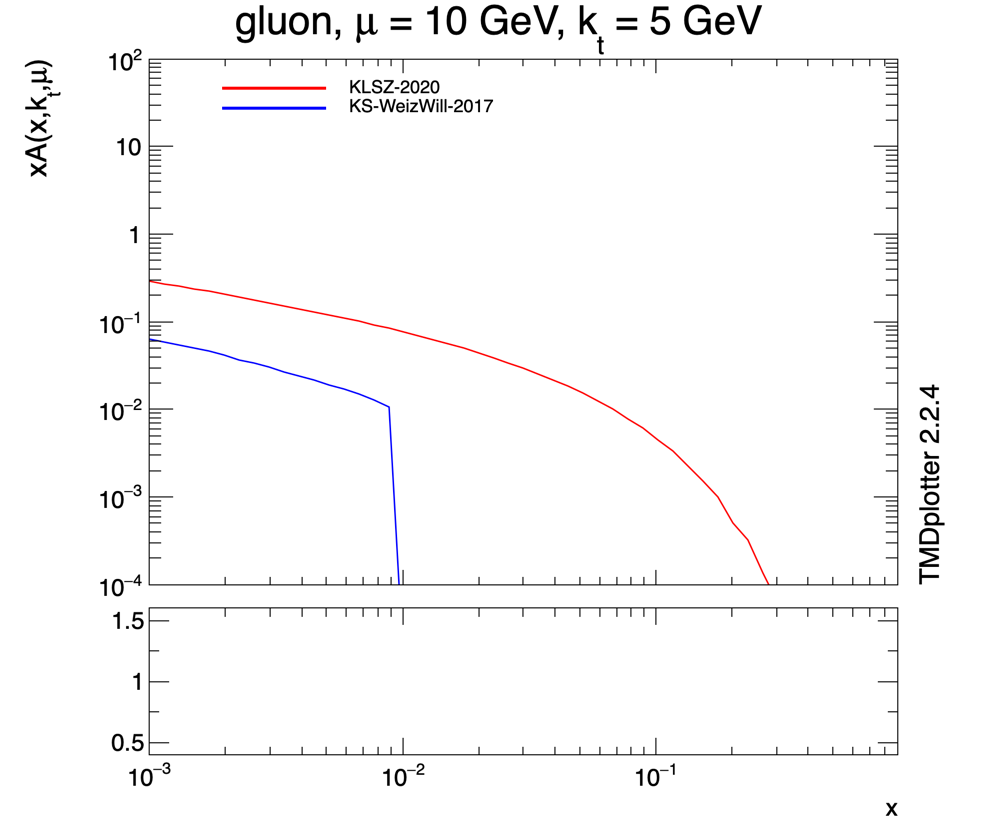
the file test.png shows the weird behavior, while test.pdf is fine.
When opening the file test.root with root and saving it as tmdplotter.png it looks also fine.

Any idea what is going wrong here ?
Thanks a lot
Cheers
Hannes

test.root (11.4 KB)


test.pdf (17.2 KB)

That’s what I suspected. That has nothing to do with the format used. I guess that some where in the macro this extra weird blue polygon is added and for some reason I do not know it is visible in the png only.
Can you try to save the canvas as a .C file and post it here ?

yes, thanks a lot, here is the .C file
Best
Hannes

test.C (27.4 KB)

The generated code is full of “nan”… that can explain …
I guess to really understand the issue we really need some code example reproducing the problem.

Thanks a lot,… that was it …
after removing the nan’s, the plot looks fine.

Thanks again
Cheers
Hannes

This topic was automatically closed 14 days after the last reply. New replies are no longer allowed.