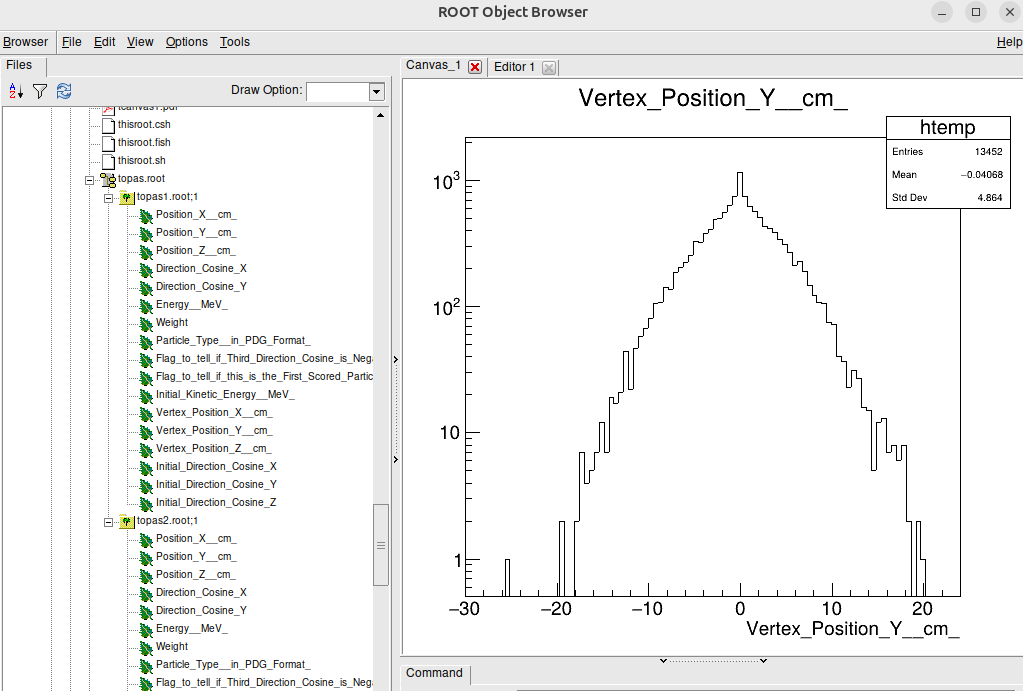
To open a phase space .root file , I am able to open it in TBrowser .But I am confused that what could be the meaning of vertex position in y cm and Position in y cm interprets ?
If anybody can elaborate the doubt. It would be really helpful.
But I am confused that what could be the meaning of vertex position in y cm and Position in y cm interprets ?
The question of how to interpret your data is best discussed with your colleagues or supervisor.
From your screenshot I can see that the TBrowser opens fine and the histogram is successfully rendered. If you do encounter a ROOT-specific issue, please let us know and we are happy to help.
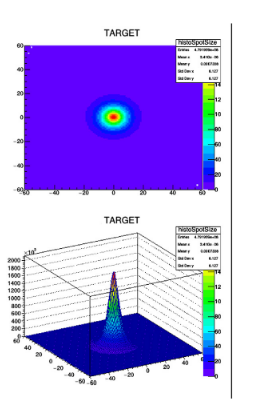
How are you getting the 2D plot? A good start is to show the code you are using to get the 2D plot. Anyway, if you already know how to do a 2D plot, the 3D plot is straightforward, just use the appropriate constructor and Fill method (expand the “Public Member Functions inherited from TH3” to see the ways to Fill it):
Then check the Drawing options for 3D histos; start here and search down the page for more about 3D options:
According to the plot you post it looks like you have a 2D histogram. The top image is produced with a command like h→Draw(“COLZ"); . I guess that’s what you call the 2D plot. To get the 3D representation below you’ll need to change the drawing option to SURF1Z
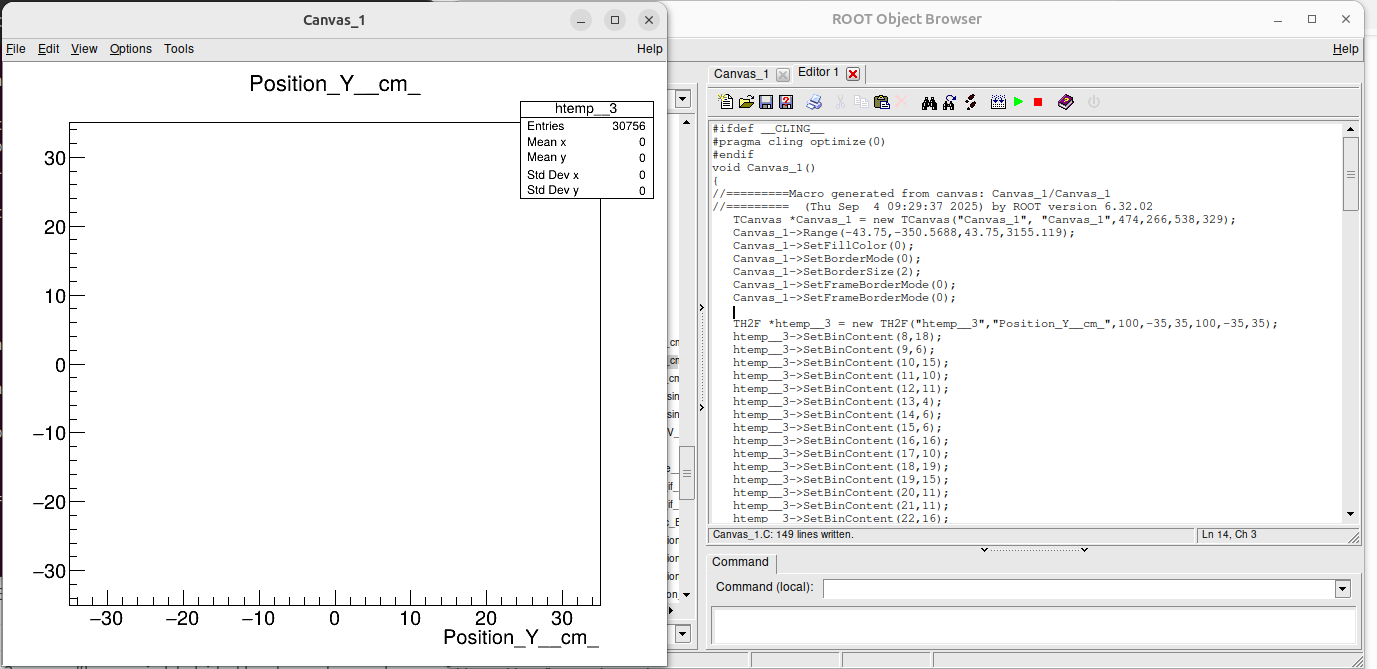
It looks like your TH2F was not filled. Can you show the code you wrote to create and fill the TH2F ? (the screen dump you posted is not clear enough, it would be nice to have a piece of code).
@couet Note that this looks like the automatically generated file (i.e., menu “Save->File->Canvas_1.C”), so maybe you should have used the “proper” method.
@Dipanuta_Behera it seems all your entries go into the “underflow” bins. In the source code which creates the histogram, try: TH2F *h = new TH2F("h", "h", 100, 0, 0, 100, 0, 0); // automatic binning
When I save a TH2 (hpxpy from hsimple.root) in a .C file the histogram content is not set by individual calls to SetBinContent but via a loop on a vector containing the bins’ contents. That’s why I am suspecting the macro was edited after being created.
@Wile_E_Coyote Yes you are right le macro was generated with 6.32. @Dipanuta_Behera This macro was obtained by saving a canvas in a .C file. But how did you create the canvas initially ?