Determining Upper Limits using ProfileLikelihoodCalculator or StandardHypoTestInv?

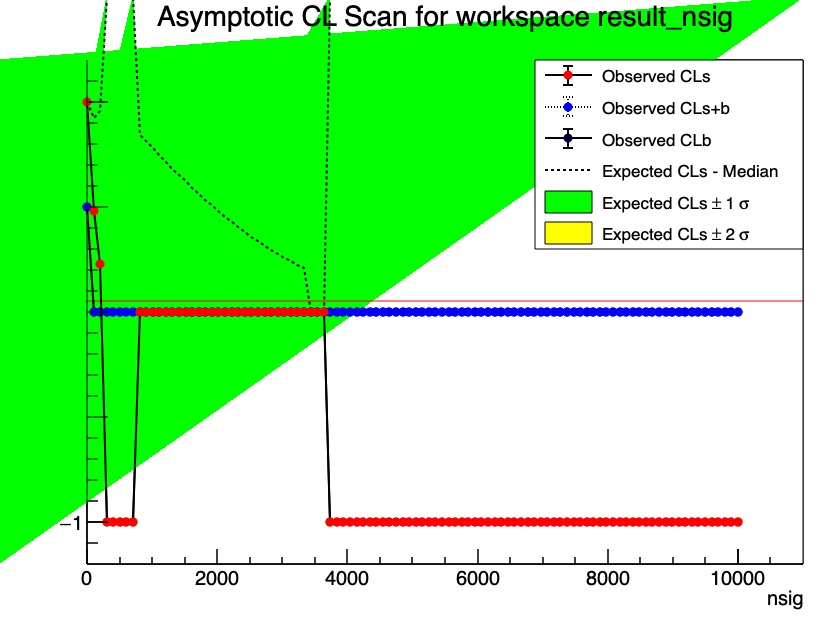
I am doing a counting experiment, looking for a particle using invariant mass analysis. I have considerable background but see no visible peak/signal. What I need to do is set an upper limit to the signal, but I am unsure which method is the best to use for my analysis. I have used ProfileLikelihoodCalculator, which gives me a number for upper limit, this is fine.

I am trying to use StandardHypoTestInvDemo.c to also compute a limit, but it’s a bit more complicated. There are a lot more inputs that I am unaware of which setting to use (calculatorType, teststatType, npoints, ntoys…). My question seems to be, which should be the better way to calculate this upper limit and which settings should I be using? I can mess around with them but i’ll really never know if I did it correctly.

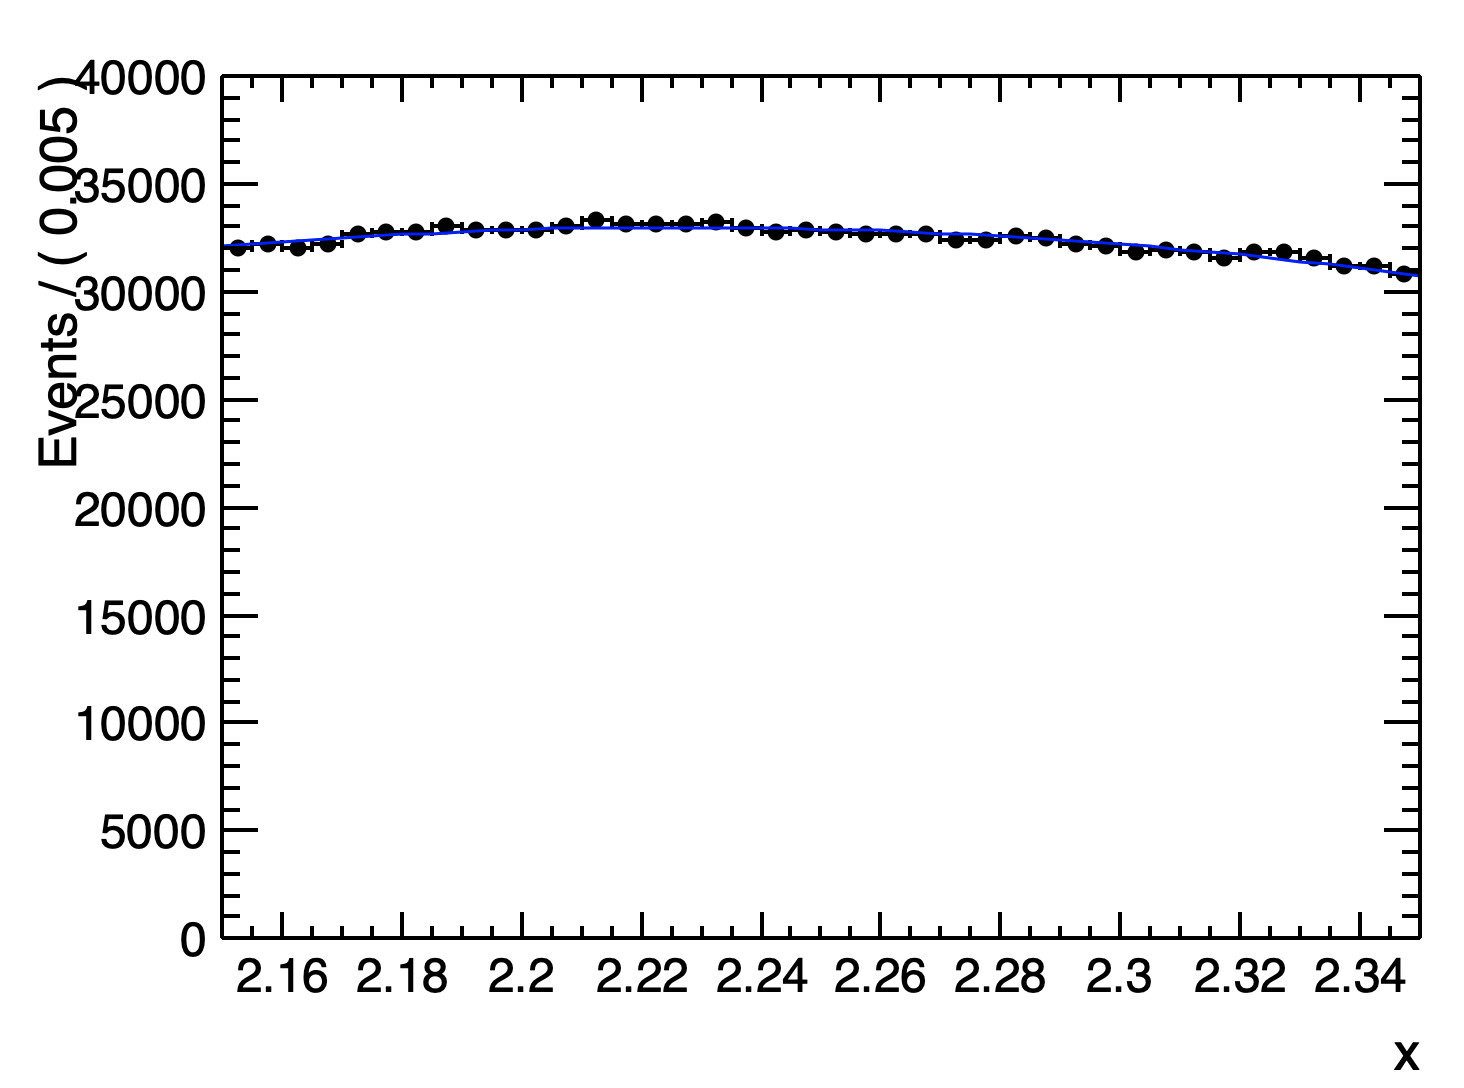
If uploaded correctly, the screenshot should have the black data points with a blue fit through them. The blue fit is a 2nd degree polynomial with a briet-wigner from 2.245 to 2.265, mean of 2.255 and width of .01. Since there is no visible signal, the background clearly dominates.

Any resources that would help me are greatly appreciated. I can also share my code and .root file if necessary. Thank you!

Hi,
I am assuming you are using the signal shape for setting an upper limits.
The recommended procedure for setting a frequentist upper limit is to use the StandardHypoTestInvDemo.C macro, (i.e. the HypoTestInverter class)
With the class you can basically compute three types of upper limits/confidence intervals:

  • Feldman-Cousins intervals
  • CLs limits using the asymptotic approximation
  • CLs limits using pseudo-experiments.

The CLs method is the one used normally by the LHC experiments, using toys or not depending on the analysis.
In your case, it seems to me your count statistics is not small, so using the asymptotic approximation should be fine.
As shown in this documentation example, you should use these options for this recommended method (asymptotic CLs):

  • calculatorType = 2 (Asymptotic Calculator)
  • testStatType = 3 (one side profile likelihood)
  • useCLs = true (use CLs for computing p-value)

The other parameters will depend on your problem:

  • npoints can be quite large (e.g. > 10) since your are using asymptotic and it is fast
  • poimin and poimax are the minimum and maximum values of your parameter that you want to scan. The upper limit should be within that range
  • ntoys is not relevant for asymptotic, and it is needed when using pseudo-experiments.

The other parameters can be used as default, since do not affect this case.

If you have further questions please let me know,

Best regards

Lorenzo

Lorenzo,
I have seen you post so often on this forum helping people and I cannot thank you enough for what you do. People like myself have tried endlessly to fix their issues and your help is a lifesaver. Just to let you know, I very much appreciate it.

But it seems I have more issues. I am very new to Roostats, so I am unsure if I am creating a proper workspace that feeds into StandardHypoTestInvDemo.c

I have seen other examples of making a workspace, but I am unsure if this is a good way to feed this into the macro. What else should I do?

    RooRealVar x("x","x", 2.15,2.35);
    RooDataHist dh("dh","dh",x,PpPhiXproj); //TH1D Object

   RooWorkspace* w = new RooWorkspace("w");
    w->factory("BreitWigner::sig_pdf(x[2.245,2.265], mean[2.255], gamma[0.01])");
    w->factory("EXPR::bkg_pdf('a+b*x+c*x*x', x,a[-701661],b[659721],c[-148108])");
    w->factory("SUM:Model(nsig[0,10000]*sig_pdf, nbkg[0,100000000]*bkg_pdf)"); 
    RooAbsPdf * Pdf = w->pdf("Model");
    RooAbsPdf * BGPdf = w->pdf("bkg_pdf");

    w->import(dh);
    
    ModelConfig *mc = new ModelConfig("ModelConfig",&*w);
    mc->SetPdf(*Pdf);
    mc->SetParametersOfInterest(*w->var("nsig"));
    mc->SetObservables(*w->var("x"));
    w->defineSet("nuisParams","a,b,c,nbkg");
    mc->SetNuisanceParameters(*w->set("nuisParams"));
    mc->SetSnapshot(*w->var("nsig"));
    w->import(*mc);

Clearly something is off since the results I get at the end are wacky.

I obviously am not looking for someone to just do my work for me, I have been trying and just need another set of eyes to show me where I went wrong and where I can improve.

Thank you so much for your help already!

Just to let you know, I tried to include the .root file with my data, but I was unable to attach it. The root-forum did not allow me to attach it because I am a new user, which is understandable. Just wanted to mention that.

Hi,
The workspace looks good to me. If you cannot attach the ROOT file containing the workspace and the input data, you can maybe send a link to it (e.g. cernbox or dropbox).
I would need your data file in order to understand and reproduce your problem

Cheers

Lorenzo

Hello Lorenzo!

Right after I said I could not send my .root file, I got a message indicating that I am now able to send it! I am going to attach the .root file as well as the macro I have been running, so you can see any changes I have made and what inputs I am using.

As another question. During my workspace setup, I made the range of n_sig and n_bkg to be 0-10000 and 0-100000000, respectively. This is because I do not know the actual values. I see that changing the value for npoints and poimax gives different upper limit calculations. Just leads me to wonder how to optimize this to make sure the value I am getting with one set of inputs is more reliable than another.

Here is the Asymptotic scan using 100 points with n_sig going from 0-10000. Looks crazy to me, though the upper limit estimation doesn’t seem off.

I am also attaching the macro I am using as well as the .root file

Thank you for your help and explanation. It is greatly appreciated.

PpPhiFILE.root (5.5 KB)
StandardHypoTestInvDemo.c (43.7 KB)

Thank you for uploading the file. I can reproduce now your problem and I will investigate it

Hi,

The problem is in your model building, you are re-defining the variable x when creating the Breit-Wigner pdf in a different range. You should use the x you have created when making the RooDataHist. Do as following:

 RooRealVar x("x","x", 2.15,2.35);
 RooDataHist dh("dh","dh",x,PpPhiXproj); //TH1D Object
   
 RooWorkspace* w = new RooWorkspace("w");
 w->import(dh);
 w->factory("BreitWigner::sig_pdf(x, mean[2.255], gamma[0.01])");

and the rest as before. By doing this I am getting sensible upper limits value, around 200, so I would do the scan from values like xmin=0 and xmax=500 for example.

Lorenzo

Wow, thank you so much. It looks great now, the results make much more sense. Thank you for helping me with this. I do not think I would have ever thought to check that x definition.

As one last question…The macro computes an upper limit, in my case it says:

> "The computed upper limit is: 296.424 +/- 0".

That’s great.

But it also has the B(alternate) model where it says:

Expected upper limits, using the B (alternate) model : 
 expected limit (median) 407.12
 expected limit (-1 sig) 229.624
 expected limit (+1 sig) 697.189
 expected limit (-2 sig) 133.698
 expected limit (+2 sig) 1085.61

What is the difference between these two? Sorry for the rather simple question.

See this note for expected limits and bands

This topic was automatically closed 14 days after the last reply. New replies are no longer allowed.