I defined a new TStyle for my histos in rootlogon.C, but I’m not able to add a new custom pretty palette to this TStyle.
Please help me!
rootlogon.C (3.34 KB)
I defined a new TStyle for my histos in rootlogon.C, but I’m not able to add a new custom pretty palette to this TStyle.
Please help me!
rootlogon.C (3.34 KB)
here is an example creating and using a user defined palette:
root.cern.ch/drupal/content/how- … or-palette
Yeah… I know!
I used similar code in my rootlogon.C but I’m not able to understand its bad behaviour…
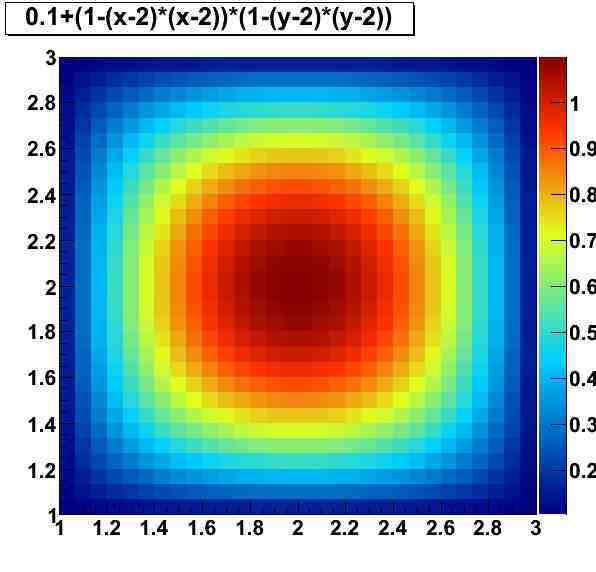
It works for me. The following macro gives me the attached image:
{
   TCanvas *c  = new TCanvas("c","Contours",600,0,600,600);
   TF2 *f1 = new TF2("f2","0.1+(1-(x-2)*(x-2))*(1-(y-2)*(y-2))",1,3,1,3);

   UInt_t NRGBs = 5;
   Double_t stops[NRGBs] = { 0.00, 0.34, 0.61, 0.84, 1.00 };
   Double_t red[NRGBs]   = { 0.00, 0.00, 0.87, 1.00, 0.51 };
   Double_t green[NRGBs] = { 0.00, 0.81, 1.00, 0.20, 0.00 };
   Double_t blue[NRGBs]  = { 0.51, 1.00, 0.12, 0.00, 0.00 };

   Int_t NCont=255;
   TColor::CreateGradientColorTable(NRGBs,stops,red,green,blue,NCont);
   f2->SetContour(NCont);
   f2->Draw("colz");
}OK thank you for the reply.
When I use your/my code in a macro using for example the Plain Style, all is OK!
But when I copy the code in rootlogon.C applying it to my TStyle crStyle, it didn’t work correctly… what it means? If you try to plot histo->Draw(“colz”), where histo is an histogram you obtain no color scale…
I don’t know if it is related to something that is initialized with a canvas…?
Cheers
I have tried to put it in my rootlogon.C also. It looks like:
{

   gStyle->SetCanvasColor(0);
   gStyle->SetFrameBorderMode(0);
   gStyle->SetStatBorderSize(1);
   gStyle->SetFrameFillColor(0);
   gStyle->SetTitleFillColor(0);

   UInt_t NRGBs = 5;
   Double_t stops[NRGBs] = { 0.00, 0.34, 0.61, 0.84, 1.00 };
   Double_t red[NRGBs]   = { 0.00, 0.00, 0.87, 1.00, 0.51 };
   Double_t green[NRGBs] = { 0.00, 0.81, 1.00, 0.20, 0.00 };
   Double_t blue[NRGBs]  = { 0.51, 1.00, 0.12, 0.00, 0.00 };

   Int_t NCont=255;
   TColor::CreateGradientColorTable(NRGBs,stops,red,green,blue,NCont);

   gROOT->ForceStyle();
   TFile hsimple("hsimple.root");
}
With this rootlogon.C all the 2D histos I plot using option COLZ use the new palette.
OK!!!
Thank you very much! I got my mistake: I missed gROOT->ForceStyle()…
OK