Hi All,
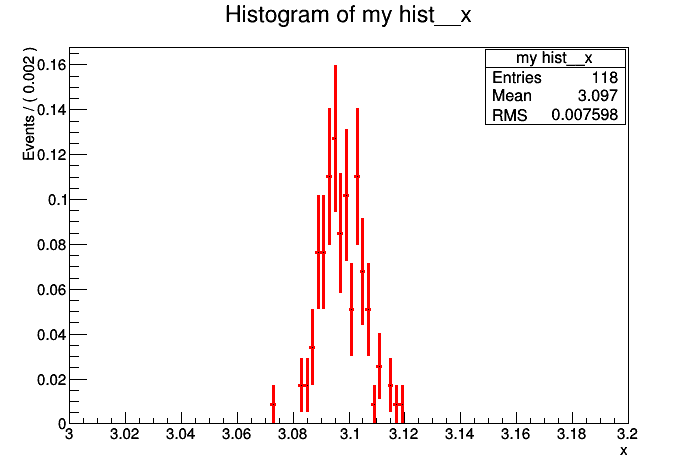
I am trying to create a histogram in roofit from the data points. After that, I normalize the histogram and draw the histogram on a canvas. But I am unable to draw the histogram as the default way in root without the error bars. Is there any other way to draw the histogram in roofit after normalizing it in default way? I am attaching the Macro and the root file and the plotted histogram. Any suggestions are most welcome.
jpsi.root (250.5 KB)
-debashis
normalized_roofit_test.C (1.2 KB)