I am looking for a way to trace back the functions called to modify plots.
I used the DrawPanel to modify canvas but I don’t find all the corresponding function and I need to make it more persistent in a compiled code.
Does someone has an idea for that ?
Thank you very much
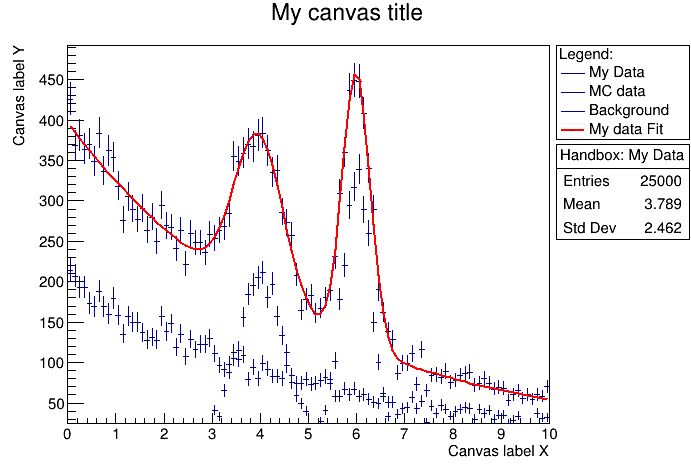
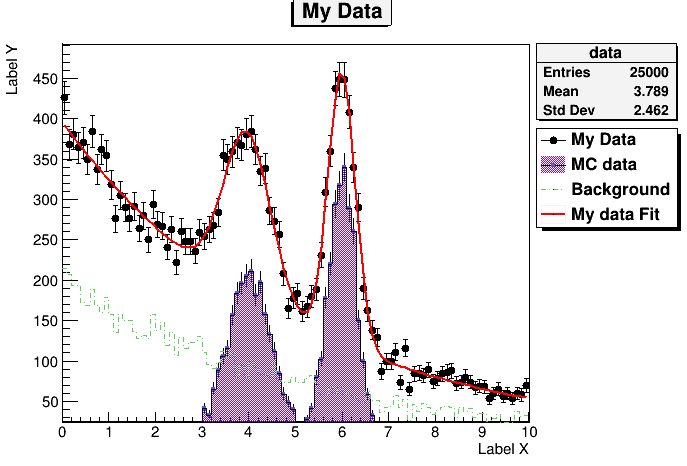
The idea here is to play with TBrowser in order to obtain the following canvas :
NB: Let’s forget about TLegend and TPaveStats.
At first I opened TBrowser and then I modified manually the canvas. The example I show here is just an example out of 20 (or more) and the idea is to apply same style everywhere. For this, I plan to develop my own TStyle.
Nevertheless I applied many modifications to my histograms and plots and I would like to traceback those modifications.
So I was wondering if it was possible with ROOT to display the real commands called behind the graphical interface.
Hope it is more clear now.
Thank you very much for your interest !