Hi
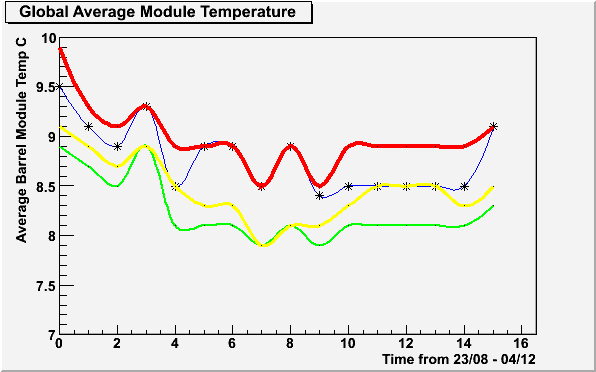
I want to plot a TGraph where the xaxis points are a set of predefined dates. At the moment I have the graph plotted for arbitrary units from 0 - 16 (see attached). I want to change each of these to say 30/10, 14/11, 27/11 …, or some other root friendly way of displaying dates.
Is this possible?
Thanks
Kate