Data points with zero entries on log scale

When I draw a histogram with the option “E0 P” on a log-y axis, I notice that the points for bins with zero entries in them are drawn on the bottom of the y-axis. Please see the example code below, which produced the attached file text.pdf.

test.pdf (15.9 KB)

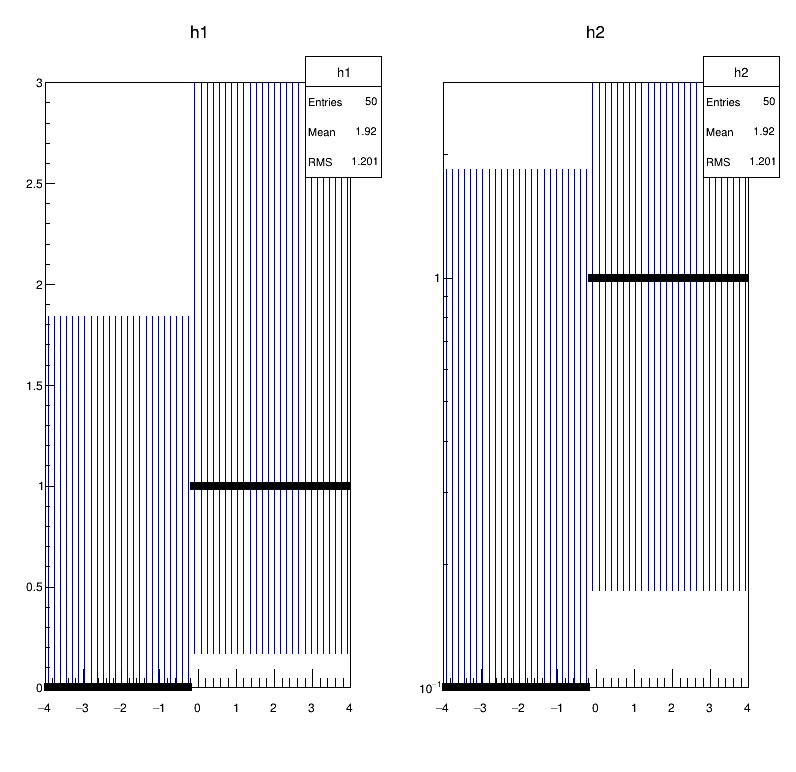
The plot on the left, with a linear y-axis, behaves as expected. For bins with zero entries, the points are not visible, but the poisson error bars are visible. The plot on the right is a similar plot, but with a log y axis. The error bars are fine, but for some reason the points for empty bins are drawn, in this case at y=1, which is wrong. Is this a bug?

I am using root version 6.02/00

Thanks,
Emyr

[code]{

TCanvas *c1 = new TCanvas(“c1”,"",800,800);
c1->Divide(2);

TH1D * h1 = new TH1D(“h1”,“h1”,50,-4,4);
h1->SetMarkerStyle(21);
h1->FillRandom(“gaus”,100);
h1->SetBinErrorOption(TH1::kPoisson);

c1->cd(1);
h1->GetYaxis()->SetRangeUser(1,15);
h1->Draw(“E0 P”);

TH1D * h2 = new TH1D(“h2”,“h2”,50,-4,4);
h2->SetMarkerStyle(21);
h2->FillRandom(“gaus”,100);
h2->SetBinErrorOption(TH1::kPoisson);

c1->cd(2);
h2->GetYaxis()->SetRangeUser(1,15);
h2->Draw(“E0, P”);

gPad->SetLogy();
gPad->Update();
}[/code]

This update produces something that is acceptable, but it is a hack, and isn’t perfect. I would still like to see a better solution.

Cheers,
Emyr

[code]
{

TCanvas *c1 = new TCanvas(“c1”,"",800,800);
c1->Divide(2);

TH1D * h1 = new TH1D(“h1”,“h1”,50,-4,4);
h1->SetMarkerStyle(21);
h1->FillRandom(“gaus”,100);
h1->SetBinErrorOption(TH1::kPoisson);

c1->cd(1);
h1->GetYaxis()->SetRangeUser(1,15);
h1->Draw(“E0 P”);

TH1D * h2 = new TH1D(“h2”,“h2”,50,-4,4);
h2->SetMarkerStyle(21);
h2->FillRandom(“gaus”,100);
h2->SetBinErrorOption(TH1::kPoisson);

c1->cd(2);
h2->GetYaxis()->SetRangeUser(1,15);
h2->SetMarkerStyle(1);
h2->Draw(“E0 X0”);

TH1D* h2c = (TH1D*) h2->Clone(“h2c”);
h2c->SetMarkerStyle(21);
h2c->SetMarkerSize(1);
h2c->Draw(“P SAME”);

gPad->SetLogy();
gPad->Update();

c1->Print(“test.pdf”);
}[/code]

I’ll check

Hi,

Is there any news on this issue?

Cheers,
Emyr

Do not put 0 … only E …
root.cern.ch/root/htmldoc/THistPainter.html#HP09

Do you mean the following:

{

  TCanvas *c1 = new TCanvas("c1","",800,800);
  c1->Divide(2);

  TH1D * h1 = new TH1D("h1","h1",50,-4,4);
  h1->SetMarkerStyle(21);
  h1->FillRandom("gaus",100);
  h1->SetBinErrorOption(TH1::kPoisson);

  c1->cd(1);
  h1->GetYaxis()->SetRangeUser(1,15);
  h1->Draw("E P");

  TH1D * h2 = new TH1D("h2","h2",50,-4,4);
  h2->SetMarkerStyle(21);
  h2->FillRandom("gaus",100);
  h2->SetBinErrorOption(TH1::kPoisson);

  c1->cd(2);
  h2->GetYaxis()->SetRangeUser(1,15);
  h2->Draw("E, P");

  gPad->SetLogy();
  gPad->Update();
}

This does not plot anything in the empty bins? I want the empty bins to be plotted, with poisson error bars.

Yes I mean that … you do not see the empty bins… That’s what you asked … no ?

Ah ok … yes … you want the error bas but not the markers…

This example might be simpler. Half the bins are empty and half have a bin content of 1. The y-axis range is set to 0.5->3. For some reason, when plotted on a log scale, the marker for the empty bins are drawn as being at the lower limit of the y-axis.

{

  TCanvas *c1 = new TCanvas("c1","",800,800);
  c1->Divide(2);

  TH1D * h1 = new TH1D("h1","h1",50,-4,4);
  h1->SetMarkerStyle(21);
  for ( int bin = 1; bin <= h1->GetNbinsX(); bin++ ) {
    if ( bin < h1->GetNbinsX()/2 ) h1->SetBinContent(bin,0);
    else h1->SetBinContent(bin,1);
  }
  h1->SetBinErrorOption(TH1::kPoisson);

  c1->cd(1);
  h1->GetYaxis()->SetRangeUser(0.5,3);
  h1->Draw("E0 P");

  TH1D * h2 = new TH1D("h2","h2",50,-4,4);
  h2->SetMarkerStyle(21);
  for ( int bin = 1; bin <= h2->GetNbinsX(); bin++ ) {
    if ( bin < h2->GetNbinsX()/2 ) h2->SetBinContent(bin,0);
    else h2->SetBinContent(bin,1);
  }
  h2->SetBinErrorOption(TH1::kPoisson);

  c1->cd(2);
  h2->GetYaxis()->SetRangeUser(0.5,3);
  h2->Draw("E0, P");

  gPad->SetLogy();
  gPad->Update();
}

Thanks … it is ok… I manage to see what you mean with a simple histogram I have.

I need more time to understand all possible side effects…

By the way, drawing a 0 entry marker when you are in log scale along Y does not really make sense as log(0) is not defined … I think in the case of logy, E0 should be the same as E even if you do not zoom… what do you think ?

Yes, the marker should not be drawn on a log scale. However, the poisson error bars (given by TH1::SetBinErrorOption(TH1::kPoisson) ) for a bin with zero entries cover 0 to ~1.8, so I would expect the error bar to be visible if the lower limit on the y-axis is less than ~1.8, as is done when the y-axis is on a linear scale.

Anyway, the issue is still there if you fill bins with something that can definitely be drawn on a log scale e.g. 0.09 with a lower limit on the y axis of 0.1:

{

  TCanvas *c1 = new TCanvas("c1","",800,800);
  c1->Divide(2);

  TH1D * h1 = new TH1D("h1","h1",50,-4,4);
  h1->SetMarkerStyle(21);
  for ( int bin = 1; bin <= h1->GetNbinsX(); bin++ ) {
    if ( bin < h1->GetNbinsX()/2 ) h1->SetBinContent(bin,0.0001);
    else h1->SetBinContent(bin,1);
  }
  h1->SetBinErrorOption(TH1::kPoisson);

  c1->cd(1);
  h1->GetYaxis()->SetRangeUser(0,3);
  h1->Draw("E0 P");

  TH1D * h2 = new TH1D("h2","h2",50,-4,4);
  h2->SetMarkerStyle(21);
  for ( int bin = 1; bin <= h2->GetNbinsX(); bin++ ) {
    if ( bin < h2->GetNbinsX()/2 ) h2->SetBinContent(bin,0.0001);
    else h2->SetBinContent(bin,1);
  }
  h2->SetBinErrorOption(TH1::kPoisson);

  c1->cd(2);
  h2->GetYaxis()->SetRangeUser(0.1,3);
  h2->Draw("E0, P");

  gPad->SetLogy();
  gPad->Update();
}

You are pointing now a new issue with the Poisson errors. I am looking at the output produced by your last macro and seems to me the errors are the same in linear and log scale. The bins containing 0.0001 have errors going up to 1.8 as you would expect.

I get the following image.


Apologies - there was a small error in the last script (I was filling with 0.0001 rather than 0.09). The correct script is below, as is an image of the output.

In any case, the same problem remains. The error bars have always been drawn correctly. On the log scale plot, the markers for bins with a content of 0.09 (or 0.00001 - anything below the lower limit of the y-axis) are drawn at 0.1 - this is clearly wrong! In this case, I would expect the marker for a bin with a content of 0.09 not to be visible as it is below the lower limit of the y axis, but I would expect the “top” of the error bar to be visible.

{

  TCanvas *c1 = new TCanvas("c1","",800,800);
  c1->Divide(2);

  TH1D * h1 = new TH1D("h1","h1",50,-4,4);
  h1->SetMarkerStyle(21);
  for ( int bin = 1; bin <= h1->GetNbinsX(); bin++ ) {
    if ( bin < h1->GetNbinsX()/2 ) h1->SetBinContent(bin,0.09);
    else h1->SetBinContent(bin,1);
  }
  h1->SetBinErrorOption(TH1::kPoisson);

  c1->cd(1);
  h1->GetYaxis()->SetRangeUser(0.1,3);
  h1->Draw("E0 P");

  TH1D * h2 = new TH1D("h2","h2",50,-4,4);
  h2->SetMarkerStyle(21);
  for ( int bin = 1; bin <= h2->GetNbinsX(); bin++ ) {
    if ( bin < h2->GetNbinsX()/2 ) h2->SetBinContent(bin,0.09);
    else h2->SetBinContent(bin,1);
  }
  h2->SetBinErrorOption(TH1::kPoisson);

  c1->cd(2);
  h2->GetYaxis()->SetRangeUser(0.1,3);
  h2->Draw("E0, P");

  gPad->SetLogy();
  gPad->Update();
}

test.pdf (15.7 KB)

Now fixed. Thanks for reporting.