I tried with more data (look at data_root.txt attached).
I used a python script
import ROOT
import re
from array import array

f = open("data_root.txt")
r = re.compile(r"[A-Za-z]{3} (\d+) (\d{2}):(\d{2}):(\d{2})")
time = array('d',[])
y = array('d',[])
for line in f:
    m = r.match(line)
    d,h,m,s = map(int,m.groups())
    time.append(ROOT.TDatime(2009,7,d,h,m,s).Convert())
    y.append(10.)

gr=ROOT.TGraph(len(time), time, y)

gr.Draw("AP")
gr.GetXaxis().SetTimeDisplay(1)
gr.GetXaxis().SetNdivisions(-503)
gr.GetXaxis().SetTimeFormat("%Y-%m-%d %H:%M")
gr.GetXaxis().SetTimeOffset(0,"gmt")

raw_input()
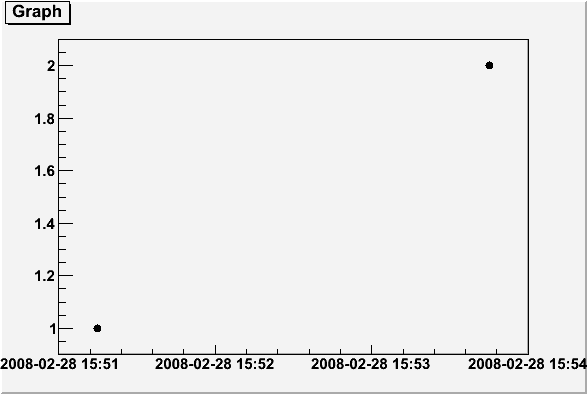
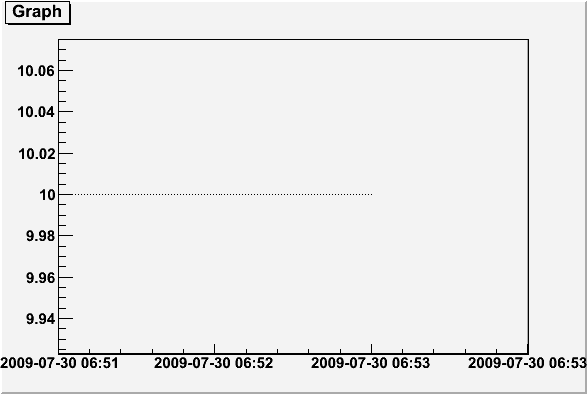
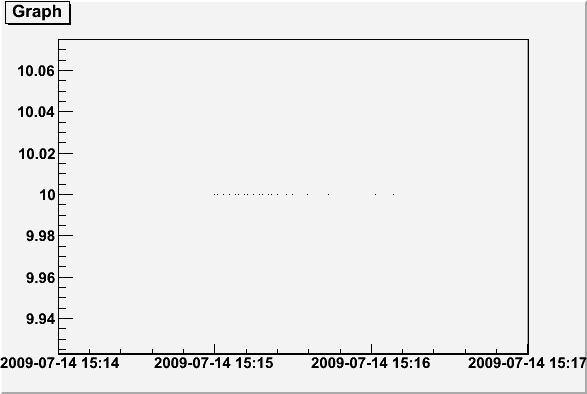
the first data must be on Jul 14 16:15:50, the last one on Jul 30 07:53:01
but looking at the attached plot there are some problems. The time is shifted by 1 hour!
I tried also with a c++ code:
#include <fstream>
#include <iostream>
#include <string>
#include <vector>

#include "TDatime.h"
#include "TGraph.h"
#include "TApplication.h"
#include "TCanvas.h"
#include "TAxis.h"

int main(int argc, char **argv){
    TApplication app("app", &argc, argv);
    std::ifstream f("data_root.txt");
    std::string line;
    std::string month;
    std::vector<double> time;
    std::vector<double> y;
    int day, hour, min, second;
    while(!f.eof())
    {
	char c;
	f >> month >> day >> hour >> c >> min >> c >> second ;
	time.push_back(TDatime::TDatime(2009,7,day,hour,min,second).Convert());
	y.push_back(10.);
    }

    TGraph gr(time.size(), &(time[0]), &(y[0]));
    TCanvas canvas("canvas");
    gr.Draw("AP");
    gr.GetXaxis()->SetTimeDisplay(1);
    gr.GetXaxis()->SetNdivisions(-503);
    gr.GetXaxis()->SetTimeFormat("%Y-%m-%d %H:%M");
    gr.GetXaxis()->SetTimeOffset(0,"gmt");

    app.Run();
}
but the result is exaclty the same.
data_root.txt (161 KB)