Cut the y-axis

Hi!

I have two sets of graphs that I wish to fit into one figure, but they are too far apart in value that it will be meaningless unless I can be able to cut or push the y-axis a bit inbetween. Is there such a function in root. Another aproach would be to add a second axis on the left, but I would prefer to cut the axis.

regards,
Karin

use class TMultiGraph. See examples in tutorials.

Rene

Dear Rene,

I have the same question which I couldn’t quickly overcome by looking neither at tutorial examples nor TMultiGraph documentation. Namely, with the following piece of code I am demonstrating:

[code]{
// results and errors:
Double_t valuesA[5] = {0.0200165,0.0200711,0.0199733,0.020749,0.0219632};
Double_t errorsA[5] = {3.16095e-05,5.90454e-05,0.000344777,0.000806074,0.000988194};
Double_t valuesB[5] = {0.149996,0.150007,0.149986,0.149987,0.149987};
Double_t errorsB[5] = {3.09035e-05,3.16321e-05,3.1863e-05,3.17724e-05,3.17655e-05};

// at these x points above results will be plotted:
Double_t x[5] = {0.5,1.5,2.5,3.5,4.5};
Double_t ex[5] = {0.};

// graph for results A:
TGraphErrors *resultsA = new TGraphErrors(5,x,valuesA,ex,errorsA);
resultsA->SetMarkerColor(kRed-3);
resultsA->SetMarkerStyle(21);

// graph for results B:
TGraphErrors *resultsB = new TGraphErrors(5,x,valuesB,ex,errorsB);
resultsB->SetMarkerColor(kBlue-3);
resultsB->SetMarkerStyle(21);

// combining both graphs:
TMultiGraph *mg = new TMultiGraph();
mg->Add(resultsA,“p”);
mg->Add(resultsB,“p”);
mg->Draw(“a”);
}[/code]

I have attached the outcome in cutAxis.png. Now I would like to ‘cut the y-axis’, so that for instance after y=0.03 the axis is ‘broken’ and than it continues from y=0.14.

The reason for doing this is that with ‘broken y-axis’ I would be able also to show the errors which are with ‘full y-axis’ to small to be visible.

Cheers,
Ante


You can something like:

[code]{
// results and errors:
Double_t valuesA[5] = {0.0200165,0.0200711,0.0199733,0.020749,0.0219632};
Double_t errorsA[5] = {3.16095e-05,5.90454e-05,0.000344777,0.000806074,0.000988194};
Double_t valuesB[5] = {0.149996,0.150007,0.149986,0.149987,0.149987};
Double_t errorsB[5] = {3.09035e-05,3.16321e-05,3.1863e-05,3.17724e-05,3.17655e-05};

// at these x points above results will be plotted:
Double_t x[5] = {0.5,1.5,2.5,3.5,4.5};
Double_t ex[5] = {0.};
TCanvas *c1 = new TCanvas(“c1”,“c1”,600,800);
c1->Divide(1,2,0,0);

c1->cd(1);
// graph for results B:
TGraphErrors *resultsB = new TGraphErrors(5,x,valuesB,ex,errorsB);
resultsB->SetMarkerColor(kBlue-3);
resultsB->SetMarkerStyle(21);
gPad->SetBottomMargin(0);
gPad->DrawFrame(0,0.14995,5,0.150052);
resultsB->Draw(“p”);

// graph for results A:
c1->cd(2);
TGraphErrors *resultsA = new TGraphErrors(5,x,valuesA,ex,errorsA);
resultsA->SetMarkerColor(kRed-3);
resultsA->SetMarkerStyle(21);
gPad->SetTopMargin(0);
gPad->DrawFrame(0,0.0194,5,0.0224);
resultsA->Draw(“p”);
c1->cd();
}[/code]

Rene

Dear Rene,

Thanks - this will do the job! I have further modified a little bit your solution and now I have it as:
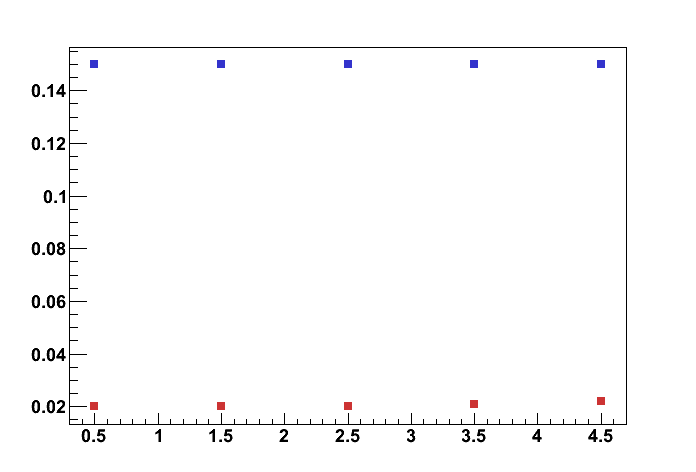
[code]
{
// results and errors:
Double_t valuesA[5] = {0.0200165,0.0200711,0.0199733,0.020749,0.0219632};
Double_t errorsA[5] = {3.16095e-05,5.90454e-05,0.000344777,0.000806074,0.000988194};
Double_t valuesB[5] = {0.149996,0.150007,0.149986,0.149987,0.149987};
Double_t errorsB[5] = {3.09035e-05,3.16321e-05,3.1863e-05,3.17724e-05,3.17655e-05};

// at these x points above results will be plotted:
Double_t x[5] = {0.5,1.5,2.5,3.5,4.5};
Double_t ex[5] = {0.};
TCanvas *c1 = new TCanvas(“c1”,“c1”,600,800);
c1->Divide(1,2,0,0);

// graph for results B:
c1->cd(1);
TGraphErrors *resultsB = new TGraphErrors(5,x,valuesB,ex,errorsB);
resultsB->SetMarkerColor(kBlue-3);
resultsB->SetMarkerStyle(21);
gPad->SetBottomMargin(0);
gPad->SetLeftMargin(0.105);
gPad->SetFrameBorderMode(0);
gPad->DrawFrame(0,0.14995,5,0.150052)->GetXaxis()->SetTickLength(0);
resultsB->Draw(“p”);

// graph for results A:
c1->cd(2);
TGraphErrors *resultsA = new TGraphErrors(5,x,valuesA,ex,errorsA);
resultsA->SetMarkerColor(kRed-3);
resultsA->SetMarkerStyle(21);
gPad->SetTopMargin(0.01);
gPad->SetFrameBorderMode(0);
gPad->SetFrameLineStyle(3);
gPad->DrawFrame(0,0.0194,5,0.0224);
resultsA->Draw(“p”);
}[/code]

Attached is the example of output in cutAxis2.png.

Thanks and cheers,
Ante