Hello,
I am trying to create a customized Palette for the colz draw option.
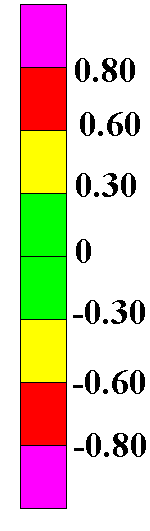
I would like to create a symmetric palette with 5 different colors and define exactly the range if bin values in which each color has to be applied. The bins takes values from -1 to 1.
Something like the Palette in attachment.
I have tried with gStyle->SetPalette but it automatically decide to equally distribute the colors.
CreateGradientColorTable is to make it appear smoother.
Thanks for your help.
Greetings,
Adriana
Try this:
{
   TCanvas *c1  = new TCanvas("c1","c1",0,0,600,400);
   TF2 *f1 = new TF2("f1","0.1+(1-(x-2)*(x-2))*(1-(y-2)*(y-2))",1,3,1,3);
   TH2D *h2 = new TH2D("h2","h2",10,0.,1.,10,0.,1.);
   h2->Fill(0,0.1,1);
   h2->Fill(0,0.2,-1);
   Int_t palette[20];
   palette[0]  = 6;
   palette[1]  = 6;
   palette[2]  = 2;
   palette[3]  = 2;
   palette[4]  = 5;
   palette[5]  = 5;
   palette[6]  = 5;
   palette[7]  = 3;
   palette[8]  = 3;
   palette[9]  = 3;
   palette[10] = 3;
   palette[11] = 3;
   palette[12] = 3;
   palette[13] = 5;
   palette[14] = 5;
   palette[15] = 5;
   palette[16] = 2;
   palette[17] = 2;
   palette[18] = 6;
   palette[19] = 6;
   gStyle->SetPalette(20,palette);
   h2->Draw("colz");
}Hello,
thanks very much for your answer. The solution you provided solves the case in with we know the maximum and minimum value.
Is it possible to do a palette in which we give the numerical intervals of the different colors? This would solve the case in which the maximum value is not known.
If the interval is between -1 and 1, it is easy to divide the interval in slots but what if I have an interval such as:
0-30 purple
30-65 red
65- 90 yellow
90-110 green
110-135 yellow
135-170 red
170 purple (without knowing the maximum value)
?
Thanks.
Cheers,
Adriana
You know the histogram you will plot don’t you ? so GetMaximum() will tell you what is the maximum value.
Hello,
as far as I understood you build the palette according to the proportion with which the colors occur in the Palette.
It is true that I always know the maximum and the minimum value of my histogram but this means that when the histogram takes a value bigger that the maximum value in the palette then I have to rebuild a new Palette with different proportions.
If for example I have a Palette in which I want in an interval of [0-200]
0-30 purple
30-65 red
65- 90 yellow
90-110 green
110-135 yellow
135-170 red
170-200 purple
I will have the palette in the macro attached.
But if my histograms takes a value like 400 then I have to create a new palette in which the colors purple appears 40 times more. Is it correct? Or maybe I misunderstood how to build the Palette.
In the example, you can see that only if I check the value I insert in the histo I can keep the palette that I want otherwise the palette is updated and changes.
The logz changes also the palette.
Thanks for your support.
Greetings,
Adriana
customPalette.C (2.21 KB)
The z scale is divided in equidistant intervals. The number of intervals is equal to the number of colors in the palette. If the maximum changes the mapping changes. The simplest way would be for you to make sure that the histograms you display have the same minimum and maximum. You can set them using SetMinimum() and SetMaximum(). That way you will need to define only one palette (the same for all histograms). This will have the advantage that you will be able to compare the histograms more easily (which at some some you may want to do). Your scale along Z starts at 0. Log(0) is not define. That is why you get a different scale with log along Z.