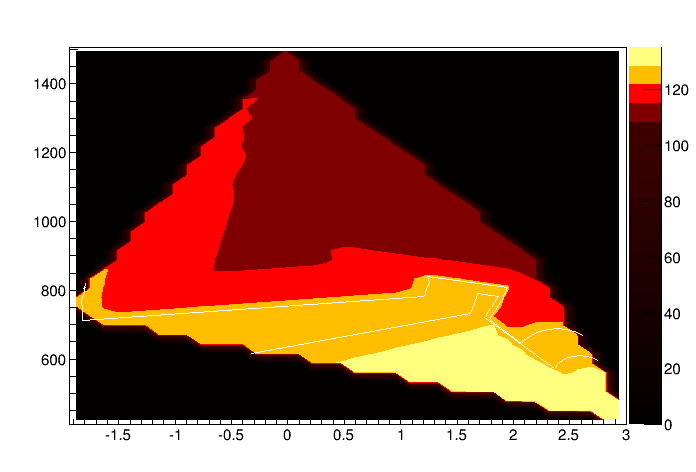
Greetings! I have this 3D data that I can now plot using CONT4Z option and I’m currently using palette 53 (black through red, yellow to white. The problem is that I have only z-points in the range 100 to 130, yet when I plot them they all appear almost white and the legend on the right shows that the colours go form 0 (black) to 130 (white), so the region I’m interested in is only a tiny fraction of the spectrum and is in almost the same colour. How can I fix that?
P.S. I did check the data file, there are NO points below z = 100.
Also you can try log scale along Z.[/quote]
Hi and thank you for your reply! I do not really need a log scale, I just need to set the “zero” of the palette (black) to some specific value. I had looked at that example above and I had tried doing that using the Length array in the example and just giving it the start, mid and end values of my data, but the colour palette was still starting from 0. What am I doing wrong?
 Double_t zmin = pl->GetZmin();
  Double_t zmax = pl->GetZmax();
  const UInt_t paletteN = 3;
  Double_t paletteRed[paletteN]    = {1.00, 0.00, 0.00}; // will change these later to use the red-orange-yellow
  Double_t paletteGreen[paletteN]  = {0.00, 1.00, 0.00}; // will change these later to use the red-orange-yellow
  Double_t paletteBlue[paletteN]   = {0.00, 0.00, 1.00}; // will change these later to use the red-orange-yellow
  Double_t paletteRange[paletteN] = {zmin, zmin/2 + zmax/2, zmax};
  Int_t nb = 50;
  TColor::CreateGradientColorTable(paletteN, paletteRange, paletteRed, paletteGreen, paletteBlue, nb);
You mean the axis on the color palette ?
This axis goes from the z-minimal value of the histogram up to the z-maximal.
It is independent of the palette you define.
[quote=“couet”][quote]
but the colour palette was still starting from 0
[/quote]
You mean the axis on the color palette ?
This axis goes from the z-minimal value of the histogram up to the z-maximal.
It is independent of the palette you define.[/quote]
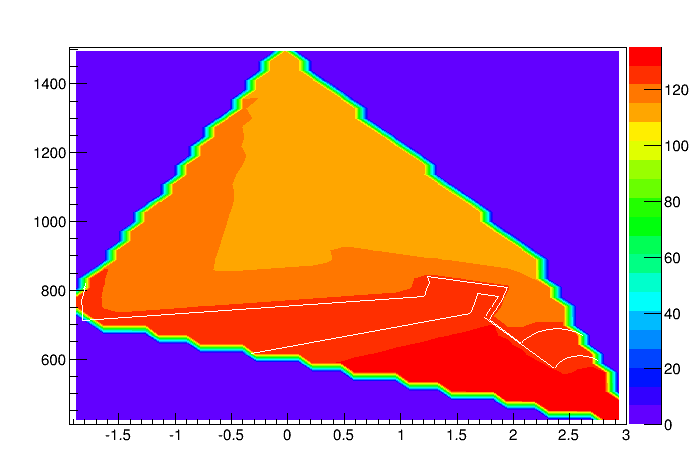
No, I mean the colours don’t match what I’ve specified in the palette - my data runs from z = 110 to z = 140 and I tried to explicitly set that:
which as far as I understood (correct me if I’m wrong) means that red is at z = 110, green is at z = 125 and blue is at z = 140. But what I get is that: selected.png
It runs from blue at z = 0 (which is where no points lie) to read at z = 140 and all of my points lie in 2 shades of red only, so I see no detail there.
One at %0 (Lenght[0] = 0) of the of the Z range and it is RGB = 1 0 1
One at 50% (Lenght[1] = 0.5) of the of the Z range and it is RGB = 0 1 0
One at 100% (Lenght[2] = 1) of the of the Z range and it is RGB = 0 0 1
So you can define more colors around the range you want. The position of the colors in given in %
One at %0 (Lenght[0] = 0) of the of the Z range and it is RGB = 1 0 1
One at 50% (Lenght[1] = 0.5) of the of the Z range and it is RGB = 0 1 0
One at 100% (Lenght[2] = 1) of the of the Z range and it is RGB = 0 0 1
So you can define more colors around the range you want. The position of the colors in given in %[/quote]
Oohh, I see… Thanks, I will try to play around with that and see if I can get what I need!