Hi!
Try to run the following script:
//// ETERM_f1
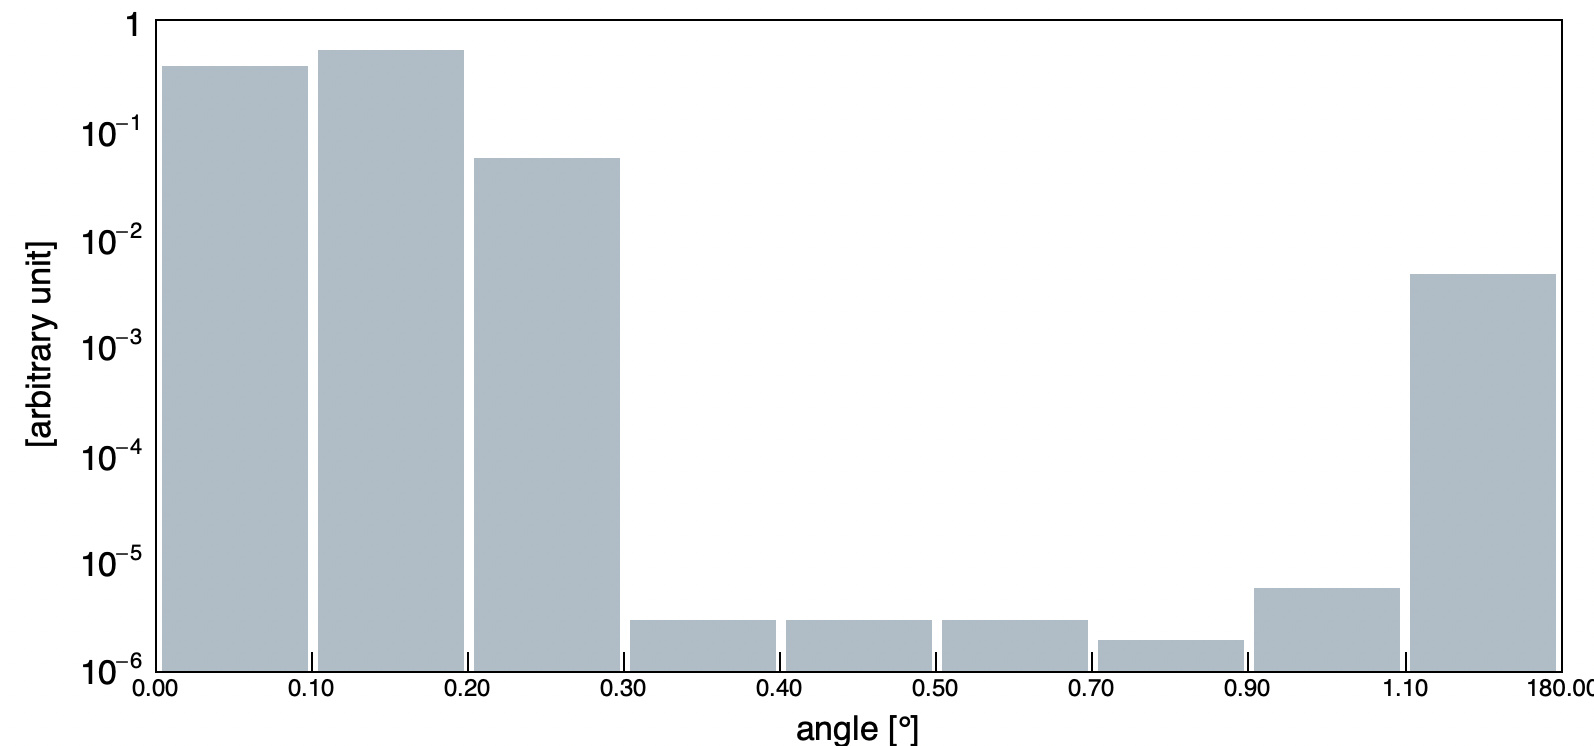
vector<Double_t> x = {0, 0.1, 0.2, 0.3, 0.4, 0.5, 0.7, 0.9, 1.1, 180};
vector<Double_t> y = {3.66037E+09, 5.24586E+09, 5.12279E+08, 2.74176E+04, 2.74176E+04, 2.74176E+04, 1.82784E+04, 5.48351E+04, 4.34203E+07};
void angularBinningSecSTerm () {
Double_t sum = 0;
for (double s : y)
sum += s;
for (int i = 0; i < y.size(); i++) {
y[i] /= sum;
}
TCanvas * c = new TCanvas("secondary_source_angular_distribution", "window", 800, 400);
c->SetMargin(0.1, 0.02, 0.1, 0.03);
// gPad->SetLogy();
TH1D * h = new TH1D("name", ";angle [#circ];[arbitrary unit]", y.size(), 0, y.size());
gStyle->SetOptStat(false);
for (Int_t i = 0; i < y.size(); i++)
h->SetBinContent(i + 1, y[i]);
h->GetXaxis()->CenterTitle(true);
h->GetXaxis()->SetLabelSize(0);
h->GetXaxis()->SetNdivisions(y.size());
h->GetXaxis()->SetTitleSize(0.05);
h->GetYaxis()->SetTickSize(0);
h->GetYaxis()->CenterTitle(true);
h->GetYaxis()->SetLabelSize(0.05);
h->GetYaxis()->SetTitleOffset(0.9);
h->GetYaxis()->SetTitleSize(0.05);
h->SetFillColor(33);
h->SetBarWidth(0.94);
h->SetBarOffset(0.03);
h->Draw("HIST BAR");
TText * label = new TText();
label->SetTextAlign(21);
label->SetTextFont(41);
label->SetTextSize(0.05);
for (Int_t i = 0; i < x.size(); i++)
label->DrawText(h->GetXaxis()->GetBinLowEdge(i+1), h->GetMinimum() - (h->GetMaximum() - h->GetMinimum()) * .07, TString::Format("%.2f", x[i]));
x.clear();
y.clear();
}
Then uncomment the gPad->SetLogy() instruction and run it again.
How can I avoid the custom labels on the x-axis to shift in the vertical direction when I set the logscale on the y-axis?
linev
October 10, 2019, 3:47pm
2
Hi,
You could try to use NDC coordinate
label->SetNDC(kTRUE);
But one should recalculate positions in normalized (0…1) coordinates
Sergey
Uhm… I don’t really understand what should I do…
couet
October 10, 2019, 4:01pm
4
The value you get on the plot in case of log scale on y is not the histogram minimum anymore because the hist minimum is 0 and an new minus (10e-6) is used. try:
    Double_t xl,yl;
    for (Int_t i = 0; i < x.size(); i++) {
      xl = h->GetXaxis()->GetBinLowEdge(i+1);
      if (gPad->GetLogy()) {
         yl = 4.25e-07;
      } else {
         yl = h->GetMinimum() - (h->GetMaximum() - h->GetMinimum()) * .07;
      }
		label->DrawText(xl, yl, TString::Format("%.2f", x[i]));
   }
couet
October 11, 2019, 6:31am
7
A simpler way is:
//// ETERM_f1
vector<Double_t> x = {0, 0.1, 0.2, 0.3, 0.4, 0.5, 0.7, 0.9, 1.1, 180};
vector<Double_t> y = {3.66037E+09, 5.24586E+09, 5.12279E+08, 2.74176E+04, 2.74176E+04, 2.74176E+04, 1.82784E+04, 5.48351E+04, 4.34203E+07};

void angularBinningSecSTerm () {

   Double_t sum = 0;
   for (double s : y) sum += s;

   for (int i = 0; i < y.size(); i++) y[i] /= sum;

   TCanvas * c = new TCanvas("secondary_source_angular_distribution", "window", 800, 400);
   c->SetMargin(0.1, 0.02, 0.1, 0.03);
   gPad->SetLogy();

   TH1D * h = new TH1D("name", ";angle [#circ];[arbitrary unit]", y.size(), 0, y.size());
   gStyle->SetOptStat(false);

   for (Int_t i = 0; i < y.size(); i++) h->SetBinContent(i + 1, y[i]);

   h->GetXaxis()->CenterTitle(true);
   h->GetXaxis()->SetNdivisions(y.size());
   h->GetXaxis()->SetTitleSize(0.05);

   h->GetYaxis()->SetTickSize(0);
   h->GetYaxis()->CenterTitle(true);
   h->GetYaxis()->SetLabelSize(0.05);
   h->GetYaxis()->SetTitleOffset(0.9);
   h->GetYaxis()->SetTitleSize(0.05);

   h->SetFillColor(33);
   h->SetBarWidth(0.94);
   h->SetBarOffset(0.03);

   h->Draw("HIST BAR");

   auto xaxis = h->GetXaxis();
   for (Int_t i = 0; i < x.size(); i++) xaxis->ChangeLabel(i+1,-1,-1,-1,1,-1,TString::Format("%.2f", x[i]));
   x.clear();
   y.clear();
}
Ok, I got it. Your macro doesn’t need any TText. So I had to add h->GetXaxis()->SetLabelSize(0.05); for changing the x-axis label size.
Thank you!
couet
October 11, 2019, 7:58am
9
Yes that’s an other approach. We keep the drawing of labels, we simply change them.
1 Like
system
October 25, 2019, 7:58am
10
This topic was automatically closed 14 days after the last reply. New replies are no longer allowed.