Csv data plotting


Please read tips for efficient and successful posting and posting code

ROOT Version: Not Provided
Platform: Not Provided
Compiler: Not Provided


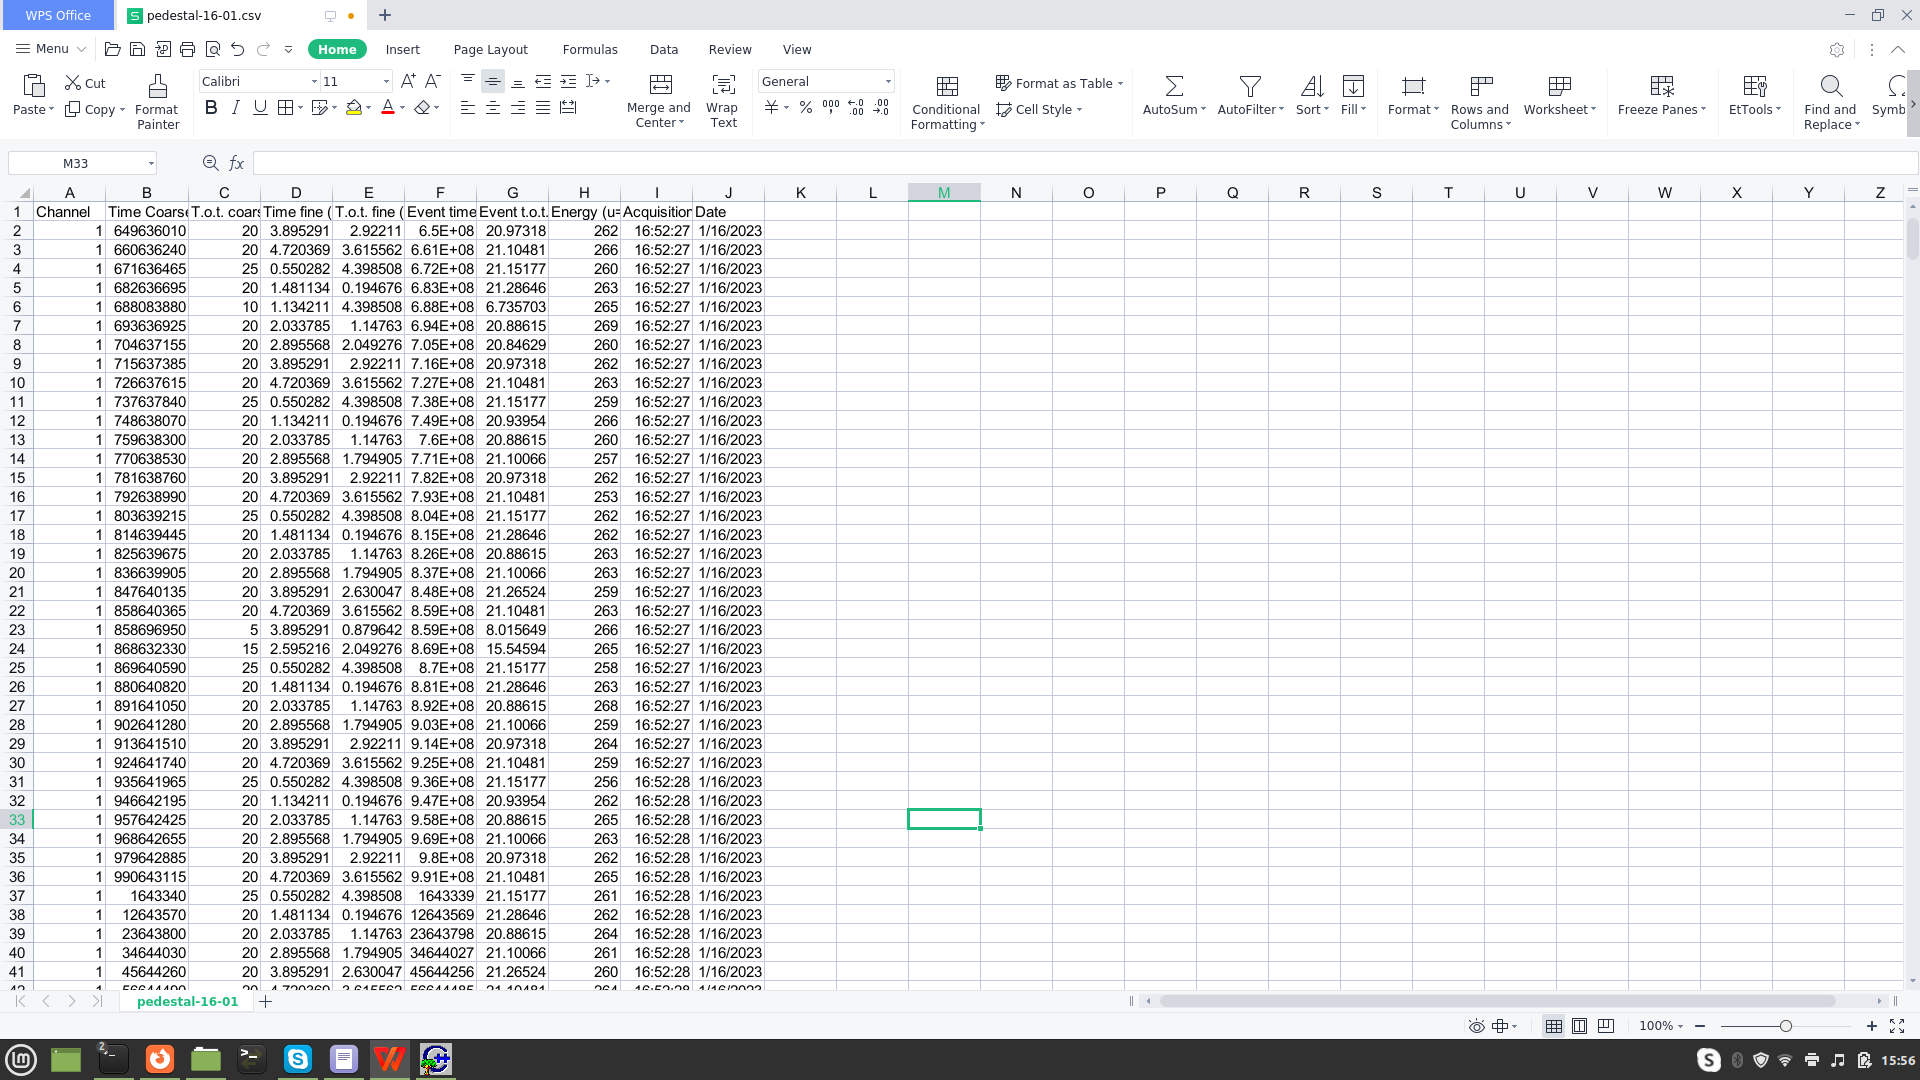
hi i want to read my data from csv file to create histogram for column 7, but i am not able to read i have not coded it well, can anybody knows,

{  

 
   TCanvas *tc = new TCanvas("ta","tb",1000,700);                     


   float x;
   int y; 
   FILE *fr1; 
   ifstream myReadFile;
   
   fr1 = fopen ("pedestal-16-01.csv", "rt"); 
   cout<<"Value of line: "<<fr1;
     char line1[80]; 
     int i = 2;
     double sum=0;
     double sumw=0;
     

     for(int j=0; j<1; j++)
       fgets(line1, 80, fr1);
    //   cout<<"This is working for loop 1st";

     vector<double> vx,vy;
     while (fgets(line1, 80, fr1) != NULL) {
       sscanf (line1, "%e %d",  &x, &y);
   //    cout<<"this is working while after for";
       
       
       vx.push_back(x);
       vy.push_back(y);
       i++;
  cout<<"i= "<<i<<endl;                                                                                                           

     }
     
     myReadFile.close();

     double deltax = vx[1]-vx[0];
     double xmax = vx[0];
     double xmin = vx[i-1];
     double nbin = i;
     cout <<nbin<<endl;
     TH1D *histo = new TH1D("histo","histo",nbin,xmin,xmax);
     cout<<"This is Working after while loop ";

     for(int k=0; k<nbin; k++){ 
       sum+=vx[k]*vy[k];
       sumw+=vy[k];

	for(int w=0;w<vy[k];w++){
       histo->Fill(vx[k]);
	}
     }
 
     
     histo->SetTitle("1");
     histo->GetXaxis()->SetTitle("c)");
     histo->GetYaxis()->SetTitle("number of events");
         histo->Rebin(5);
  
     histo->Draw("Hist");


}

One way:

void readcolumn7() {
  // Open the CSV file
  FILE* file = fopen("file.csv", "r");
  char line[1024];
  // Skip the first line (header)
  fgets(line, 1024, file);

  double column7[1000];
  int n = 0;

  // Read the data from the CSV file
  while (fgets(line, 1024, file)) {
    double x;
    int y;
    sscanf(line, "%*f,%*f,%*f,%*f,%*f,%*f,%lf,%d", &x, &y);
    column7[n++] = x;
  }

  // Do something with the data in column 7
  for (int i = 0; i < n; i++) {
    cout << column7[i] << endl;
  }

  fclose(file);
}

readcolumn7.C (1.1 KB)

Channel Time Coarse (u=ns) T.o.t. coarse (u=ns) Time fine (u=ns) T.o.t. fine (u=ns) Event time (ns) Event t.o.t. (ns) Energy (u= ADC channels) Acquisition time Date
1 649636010 20 3.895291471 2.922109958 649636006.1 20.97318151 262 16:52:27 1/16/2023
1 660636240 20 4.72036942 3.615562221 660636235.3 21.1048072 266 16:52:27 1/16/2023
1 671636465 25 0.550282196 4.398508111 671636464.4 21.15177409 260 16:52:27 1/16/2023
1 682636695 20 1.48113431 0.194675771 682636693.5 21.28645854 263 16:52:27 1/16/2023
1 688083880 10 1.134210838 4.398508111 688083878.9 6.735702727 265 16:52:27 1/16/2023
1 693636925 20 2.033784584 1.147629948 693636923 20.88615464 269 16:52:27 1/16/2023
1 704637155 20 2.895567747 2.049275763 704637152.1 20.84629198 260 16:52:27 1/16/2023
1 715637385 20 3.895291471 2.922109958 715637381.1 20.97318151 262 16:52:27 1/16/2023
1 726637615 20 4.72036942 3.615562221 726637610.3 21.1048072 263 16:52:27 1/16/2023
1 737637840 25 0.550282196 4.398508111 737637839.4 21.15177409 259 16:52:27 1/16/2023
1 748638070 20 1.134210838 0.194675771 748638068.9 20.93953507 266 16:52:27 1/16/2023
1 759638300 20 2.033784584 1.147629948 759638298 20.88615464 260 16:52:27 1/16/2023
1 770638530 20 2.895567747 1.794904685 770638527.1 21.10066306 257 16:52:27 1/16/2023
1 781638760 20 3.895291471 2.922109958 781638756.1 20.97318151 262 16:52:27 1/16/2023
1 792638990 20 4.72036942 3.615562221 792638985.3 21.1048072 253 16:52:27 1/16/2023
1 803639215 25 0.550282196 4.398508111 803639214.4 21.15177409 262 16:52:27 1/16/2023
1 814639445 20 1.48113431 0.194675771 814639443.5 21.28645854 262 16:52:27 1/16/2023
1 825639675 20 2.033784584 1.147629948 825639673 20.88615464 263 16:52:27 1/16/2023
1 836639905 20 2.895567747 1.794904685 836639902.1 21.10066306 263 16:52:27 1/16/2023
1 847640135 20 3.895291471 2.630046967 847640131.1 21.2652445 259 16:52:27 1/16/2023
1 858640365 20 4.72036942 3.615562221 858640360.3 21.1048072 263 16:52:27 1/16/2023
1 858696950 5 3.895291471 0.87964242 858696946.1 8.015649051 266 16:52:27 1/16/2023
1 868632330 15 2.595216482 2.049275763 868632327.4 15.54594072 265 16:52:27 1/16/2023
1 869640590 25 0.550282196 4.398508111 869640589.4 21.15177409 258 16:52:27 1/16/2023
1 880640820 20 1.48113431 0.194675771 880640818.5 21.28645854 263 16:52:27 1/16/2023
1 891641050 20 2.033784584 1.147629948 891641048 20.88615464 268 16:52:27 1/16/2023
1 902641280 20 2.895567747 1.794904685 902641277.1 21.10066306 259 16:52:27 1/16/2023
1 913641510 20 3.895291471 2.922109958 913641506.1 20.97318151 264 16:52:27 1/16/2023
1 924641740 20 4.72036942 3.615562221 924641735.3 21.1048072 259 16:52:27 1/16/2023
1 935641965 25 0.550282196 4.398508111 935641964.4 21.15177409 256 16:52:28 1/16/2023
1 946642195 20 1.134210838 0.194675771 946642193.9 20.93953507 262 16:52:28 1/16/2023
1 957642425 20 2.033784584 1.147629948 957642423 20.88615464 265 16:52:28 1/16/2023
1 968642655 20 2.895567747 1.794904685 968642652.1 21.10066306 263 16:52:28 1/16/2023
1 979642885 20 3.895291471 2.922109958 979642881.1 20.97318151 262 16:52:28 1/16/2023
1 990643115 20 4.72036942 3.615562221 990643110.3 21.1048072 265 16:52:28 1/16/2023
1 1643340 25 0.550282196 4.398508111 1643339.45 21.15177409 261 16:52:28 1/16/2023
1 12643570 20 1.48113431 0.194675771 12643568.52 21.28645854 262 16:52:28 1/16/2023
1 23643800 20 2.033784584 1.147629948 23643797.97 20.88615464 264 16:52:28 1/16/2023

i have data like this, can you trace out error in the macro, thanks

That’s not a CSV file… It looks like a table in markdown format. Can you post the file pedestal-16-01.csv? it should be an ASCII file.

this csv file opens in excel, unfortunately its is not attacable here

pedestal-16-01.txt (2.9 MB)
i converted it to txt now

This is not a CSV file. In a CSV file, the values are separated by a comma: ,

Example:

1,2,3,4,5,6,7,8,9
1,2,3,4,5,6,7,8,9
1,2,3,4,5,6,7,8,9
1,2,3,4,5,6,7,8,9
1,2,3,4,5,6,7,8,9
1,2,3,4,5,6,7,8,9
1,2,3,4,5,6,7,8,9
1,2,3,4,5,6,7,8,9
1,2,3,4,5,6,7,8,9
1,2,3,4,5,6,7,8,9


like that

That’s a screen dump of your computer, that’s not a csv file.
See: Import or export text (.txt or .csv) files - Microsoft Support

actually i aquire the data which is .csv file and then opens in excel.
i want only to plot energy values in column 7

So use the original .csv file you got. It should be formatted as I said: with commas separating the values. They you can elaborate from the example I sent you . It reads only the column7.