_ROOT Version: 6.22/08
_Platform: Ubuntu 20.04.2 LTS
_Compiler: g++
I made a post a year ago about the ability to fit at the end of a bin. I was told there was no direct way to do it. However, I was told another method I proposed would work.
I recently realized an issue with my proposed method (make a graph from the histogram with the graph points being at the end of the bins) is that I am not able to fit a graph with the log-likelihood method. I need to be able to both, fit a histogram at the end of its bins and fit that data with the log-likelihood method. I have a method to do that but I need to confirm how specifically root fits histogram to make sure it will work.
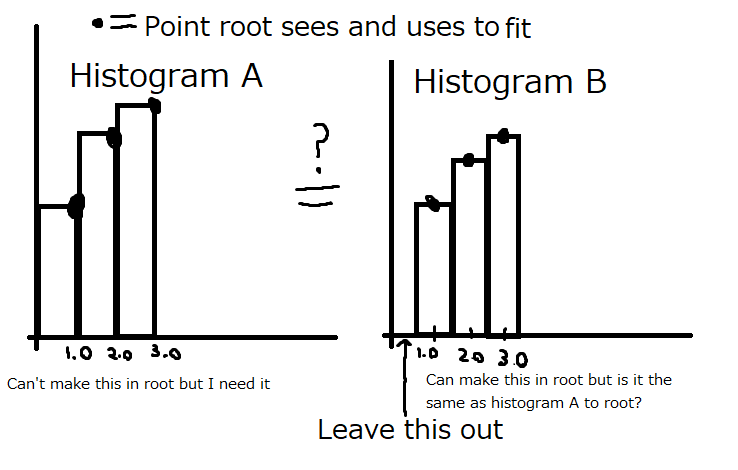
My idea is to take the histogram I want to fit, shift over the bins by half a bin width, then tell root to leave out that first empty half bin space (from moving the bins over) and fit as normal. So for example, if I was originally fitting a histogram from 0 to 400 and my bin width is 1. In my new histogram the bins would all by shifted over by 0.5 and I would now be fitting from 0.5 to 400.5.
My question is, will telling root to exclude that first width of 0.5 effect my fit if no data point occur in that width of 0.5? Putting this another way, if I had my original histogram of bin width 1 and fit from 0 to 400, would I get different fit values if I fit from 0.001 to 400? I wouldn’t think so because I assume when root fits a histogram, it only “sees” the points made by the middle of the histogram bins. However, if root considers more than just the data point made by the middle of the bin then I can see how I could get a different result between fitting from 0.001 to 400 and from 0 to 400. The information I am working with is sensitive to changes made at the beginning of the fit which is why such a small detail is important.