Please read tips for efficient and successful posting and posting code
ROOT Version: 6.22/00
Platform:Ubuntu 20.04.1 LTS (WSL2)
Compiler:GNU or GCC
Hello,
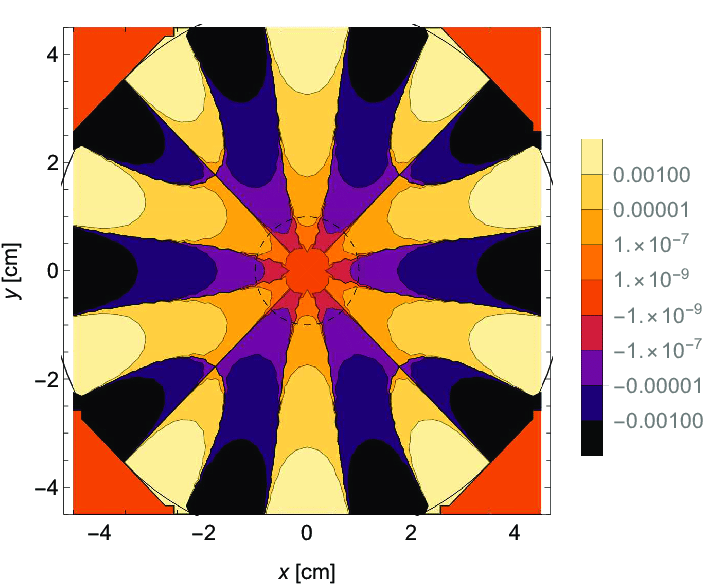
I’m trying to create a contour plot of a magnetic field from an octupole magnet from a txt file and displaying it with an information bar with information about the magnetic field strength. I have
succeeded in creating the contour plot, but I haven’t figured out of how to add an information bar beside the plot. Here is my code. I would want something like this picture to the right
#include "TFile.h"
#include "TTree.h"
#include "TCanvas.h"
#include "TH1F.h"
#include <iostream>

using namespace std;


void Contour_Plot(){

  const Int_t NRGBs = 5;
  const Int_t NCont = 99;

  Double_t stops[NRGBs] = { 0.00, 0.34, 0.61, 0.84, 1.00 };
  Double_t red[NRGBs]   = { 0.00, 0.00, 0.87, 1.00, 0.51 };
  Double_t green[NRGBs] = { 0.00, 0.81, 1.00, 0.20, 0.00 };
  Double_t blue[NRGBs]  = { 0.51, 1.00, 0.12, 0.00, 0.00 };
  TColor::CreateGradientColorTable(NRGBs, stops, red, green, blue, NCont);
  gStyle->SetNumberContours(NCont);

   TGraph2D *g=new TGraph2D("TestFile.txt","%lg %lg %lg");

   g->SetNpx(200);
   g->SetNpy(200);

g->Draw("COL");
}