Hi,
for completeness, to add to the solutions already proposed and since @couet mentions it, I tried to run RDataFrame on your data.
RDataFrame requires ROOT v6.14 or greater, it’s a fairly new development and as such it still has some rough edges, but it offers a nice high-level syntax for data analysis and manipulation.
To work around some limitations in RDF’s text file processing I had to change the first line of "8000_loss_history_0.06.txt" to 0.0 0.0 0.0 (all floating point zeroes, with a single space in between them): the floating point zero helps RDataFrame to correctly infer the type of your data as double, not int; the single space in between is because variable spacing between fields is not supported (we should add support, I’ll open a bug report about this).
Concretely speaking, you can type this at prompt or put this in a macro:
auto df = ROOT::RDF::MakeCsvDataFrame(/*file=*/"8000_loss_history_0.06.txt",
                                      /*file_has_header=*/false,
                                      /*data_delimiter=*/' ');
// if no header is present, your columns are given default names Col0, Col1, ...
auto graph = df.Graph("Col1", "Col0");
graph->Draw("AL");
or in a one-liner
ROOT::RDF::MakeCsvDataFrame("8000_loss_history_0.06.txt", false, ' ').Graph("Col1", "Col0")->DrawClone("AL");
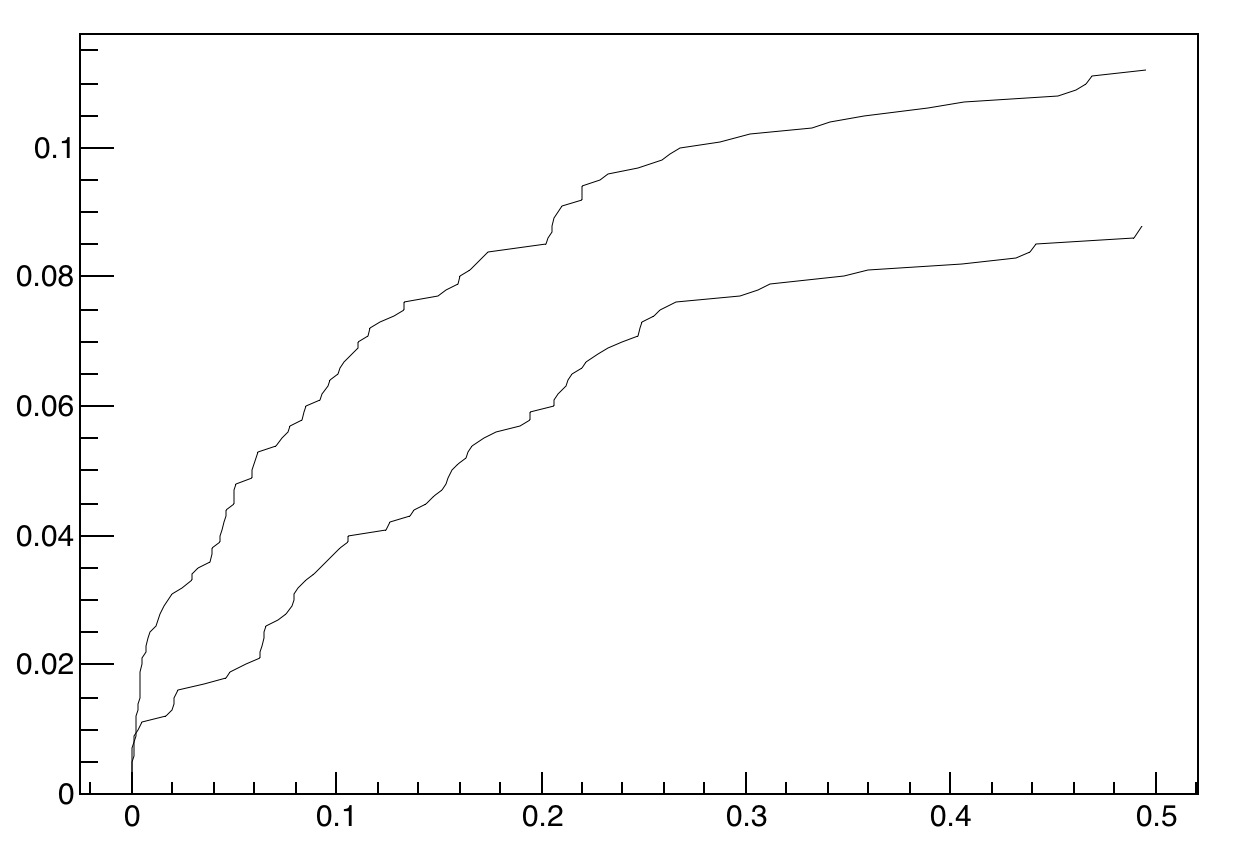
To display the two graphs together you can add them to a TMultiGraph with multigraph->Add(dataframegraph.GetPtr()):
auto g1 = ROOT::RDF::MakeCsvDataFrame("file1.txt", false, ' ').Graph("Col1", "Col0");
auto g2 = ROOT::RDF::MakeCsvDataFrame("file2.txt", false, ' ').Graph("Col1", "Col0");
TMultiGraph mg;
mg.Add(g1.GetPtr());
mg.Add(g2.GetPtr());
mg.Draw("AL");
Hope this helps!
Cheers,
Enrico