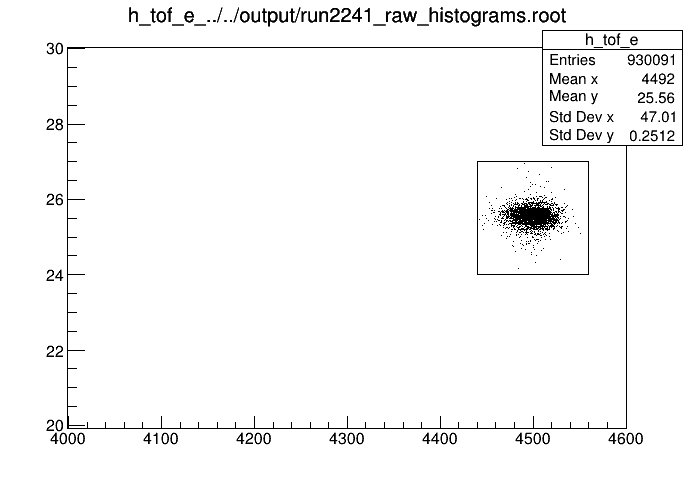
Hi, I am having issues with getting the number of entries within a graphical cut. The histogram I am looking at is within a directory in the root file, that is the reason for cd’ing into a directory at the beginning. My cut does not seem to report the number of counts within the cut region, but rather the total number of entries in the entire histogram. All of the tutorials I’ve seen online have done this automatically, so I’m not sure what I’m missing.
void alpha_cut()
{
    //open the file and cd into the directory where the tof vs energy histogram is
    TFile *sfile = TFile::Open("run2241_raw_histograms.root");
    sfile->cd("focal_plane_detector_time_vs_energy");

    //get the tof vs energy histogram
    TH2F *tof = (TH2F*)gDirectory->Get("h_tof_e");

    //define the cut we want
    TCutG *cutg = new TCutG("ilikeurcutg",5);
    cutg->SetVarX("h_tof_e_../../output/run2241_raw_histograms.root");
    cutg->SetVarY("");
    cutg->SetTitle("Graph");
    cutg->SetFillStyle(1000);
    cutg->SetPoint(0,4560,24);
    cutg->SetPoint(1,4440,24);
    cutg->SetPoint(2,4440,27);
    cutg->SetPoint(3,4560,27);
    cutg->SetPoint(4,4560,24);

    //draw the plot and the cut region
    tof->Draw("[ilikeurcutg]");
    cutg->Draw("l");
    tof->GetXaxis()->SetRangeUser(4000,4600);
    tof->GetYaxis()->SetRangeUser(20,30);
}
and here is the output of running this macro in root,
ROOT Version: 6.24.06
Platform: Linux
Compiler: Not Provided