ROOT Version: 6.30
Platform: win10
Compiler: vs c++
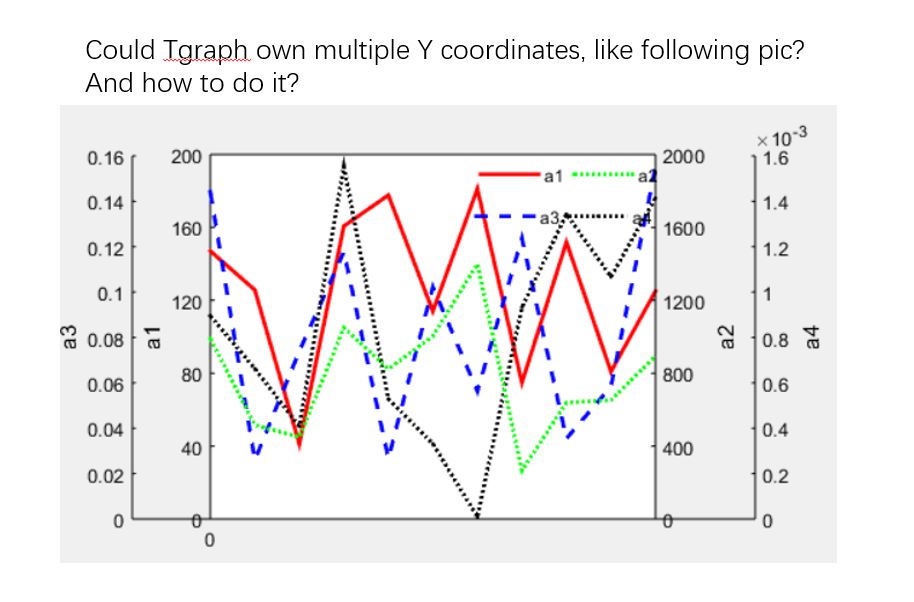
Could Tgraph own multiple Y coordinates?
Hi,
Thanks for the question.
Yes you can.
For example:
// Dummy graph
TGraphErrors g(8);
for (auto i : ROOT::TSeqI(8)) {
    g.SetPoint(i, i+.5, 1+(i*i)*.1);
    g.SetPointError(i, 0.2, 0.8/(i+1));
}
g.SetLineColor(kBlue);
g.SetLineWidth(3);

// Prepare second axis
TGaxis axis4(-.5,0,-.5,7,1,10000,50510,"G");
axis4.SetTitle("My New Axis");

// And draw
g.Draw("APE");
axis4.Draw("Same");
All the relevant doc to draw additional axes can be found here: ROOT: TGaxis Class Reference
Let us know how this goes!
Cheers,
D
There is no pic on c1.
There is also this example:
https://root.cern/doc/master/transpad_8C.html
But the basic idea is the same: Using TGaxis
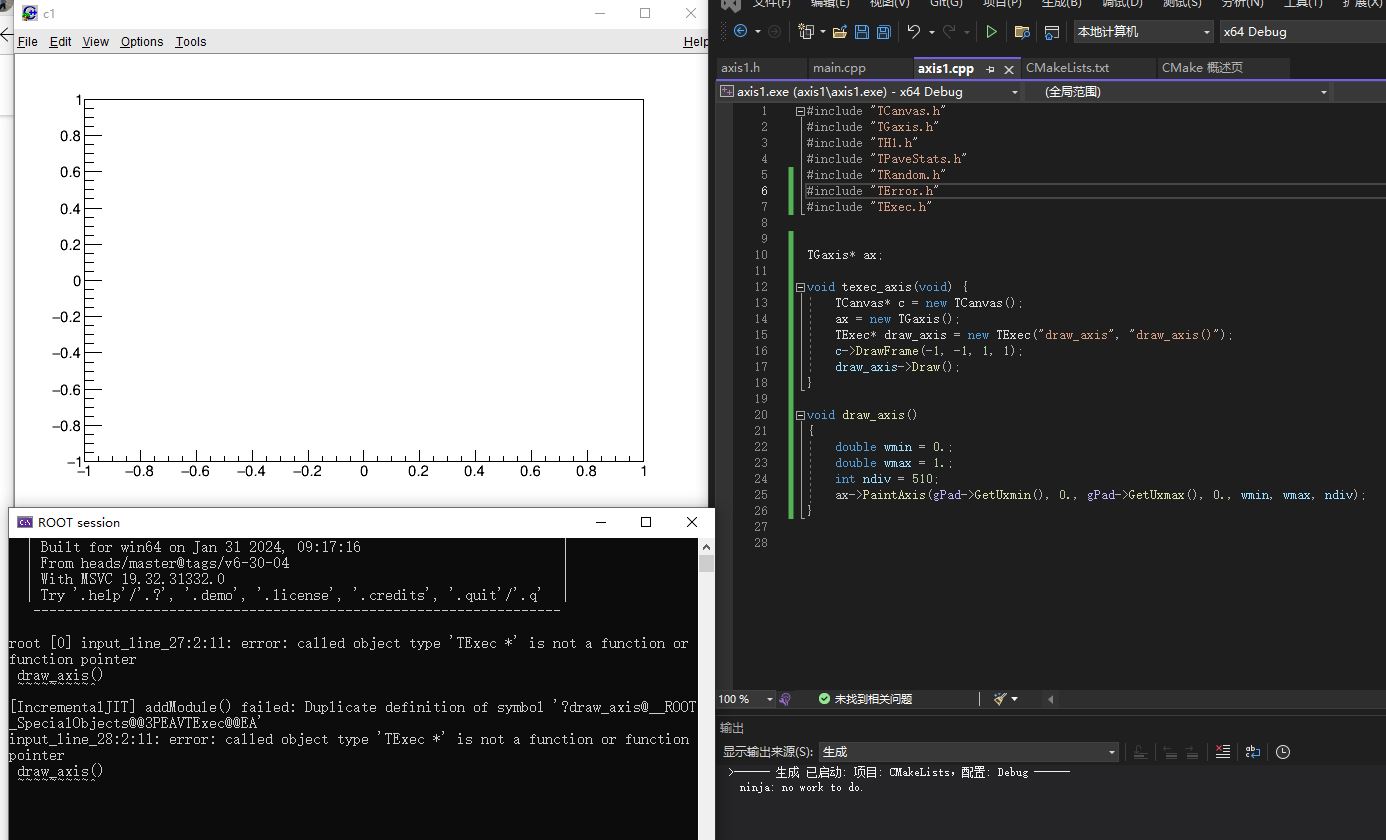
Because in this example the axis is static. Painted only once with fix coordinates. It could be done dynamic using TExec for instance.
I had try, but not success.
Could you help me using this tutorials to achieve it.
Win 10, vs c++ .
TGaxis *ax;

void texec_axis(void){
   TCanvas *c =new TCanvas();
   ax = new TGaxis();
   TExec *draw_axis = new TExec("draw_axis","draw_axis()");
   c->DrawFrame(-1,-1,1,1);
   draw_axis->Draw();
}

void draw_axis()
{
   double wmin = 0.;
   double wmax = 1.;
   int ndiv = 510;
   ax->PaintAxis(gPad->GetUxmin(),0.,gPad->GetUxmax(),0.,wmin,wmax,ndiv);
}
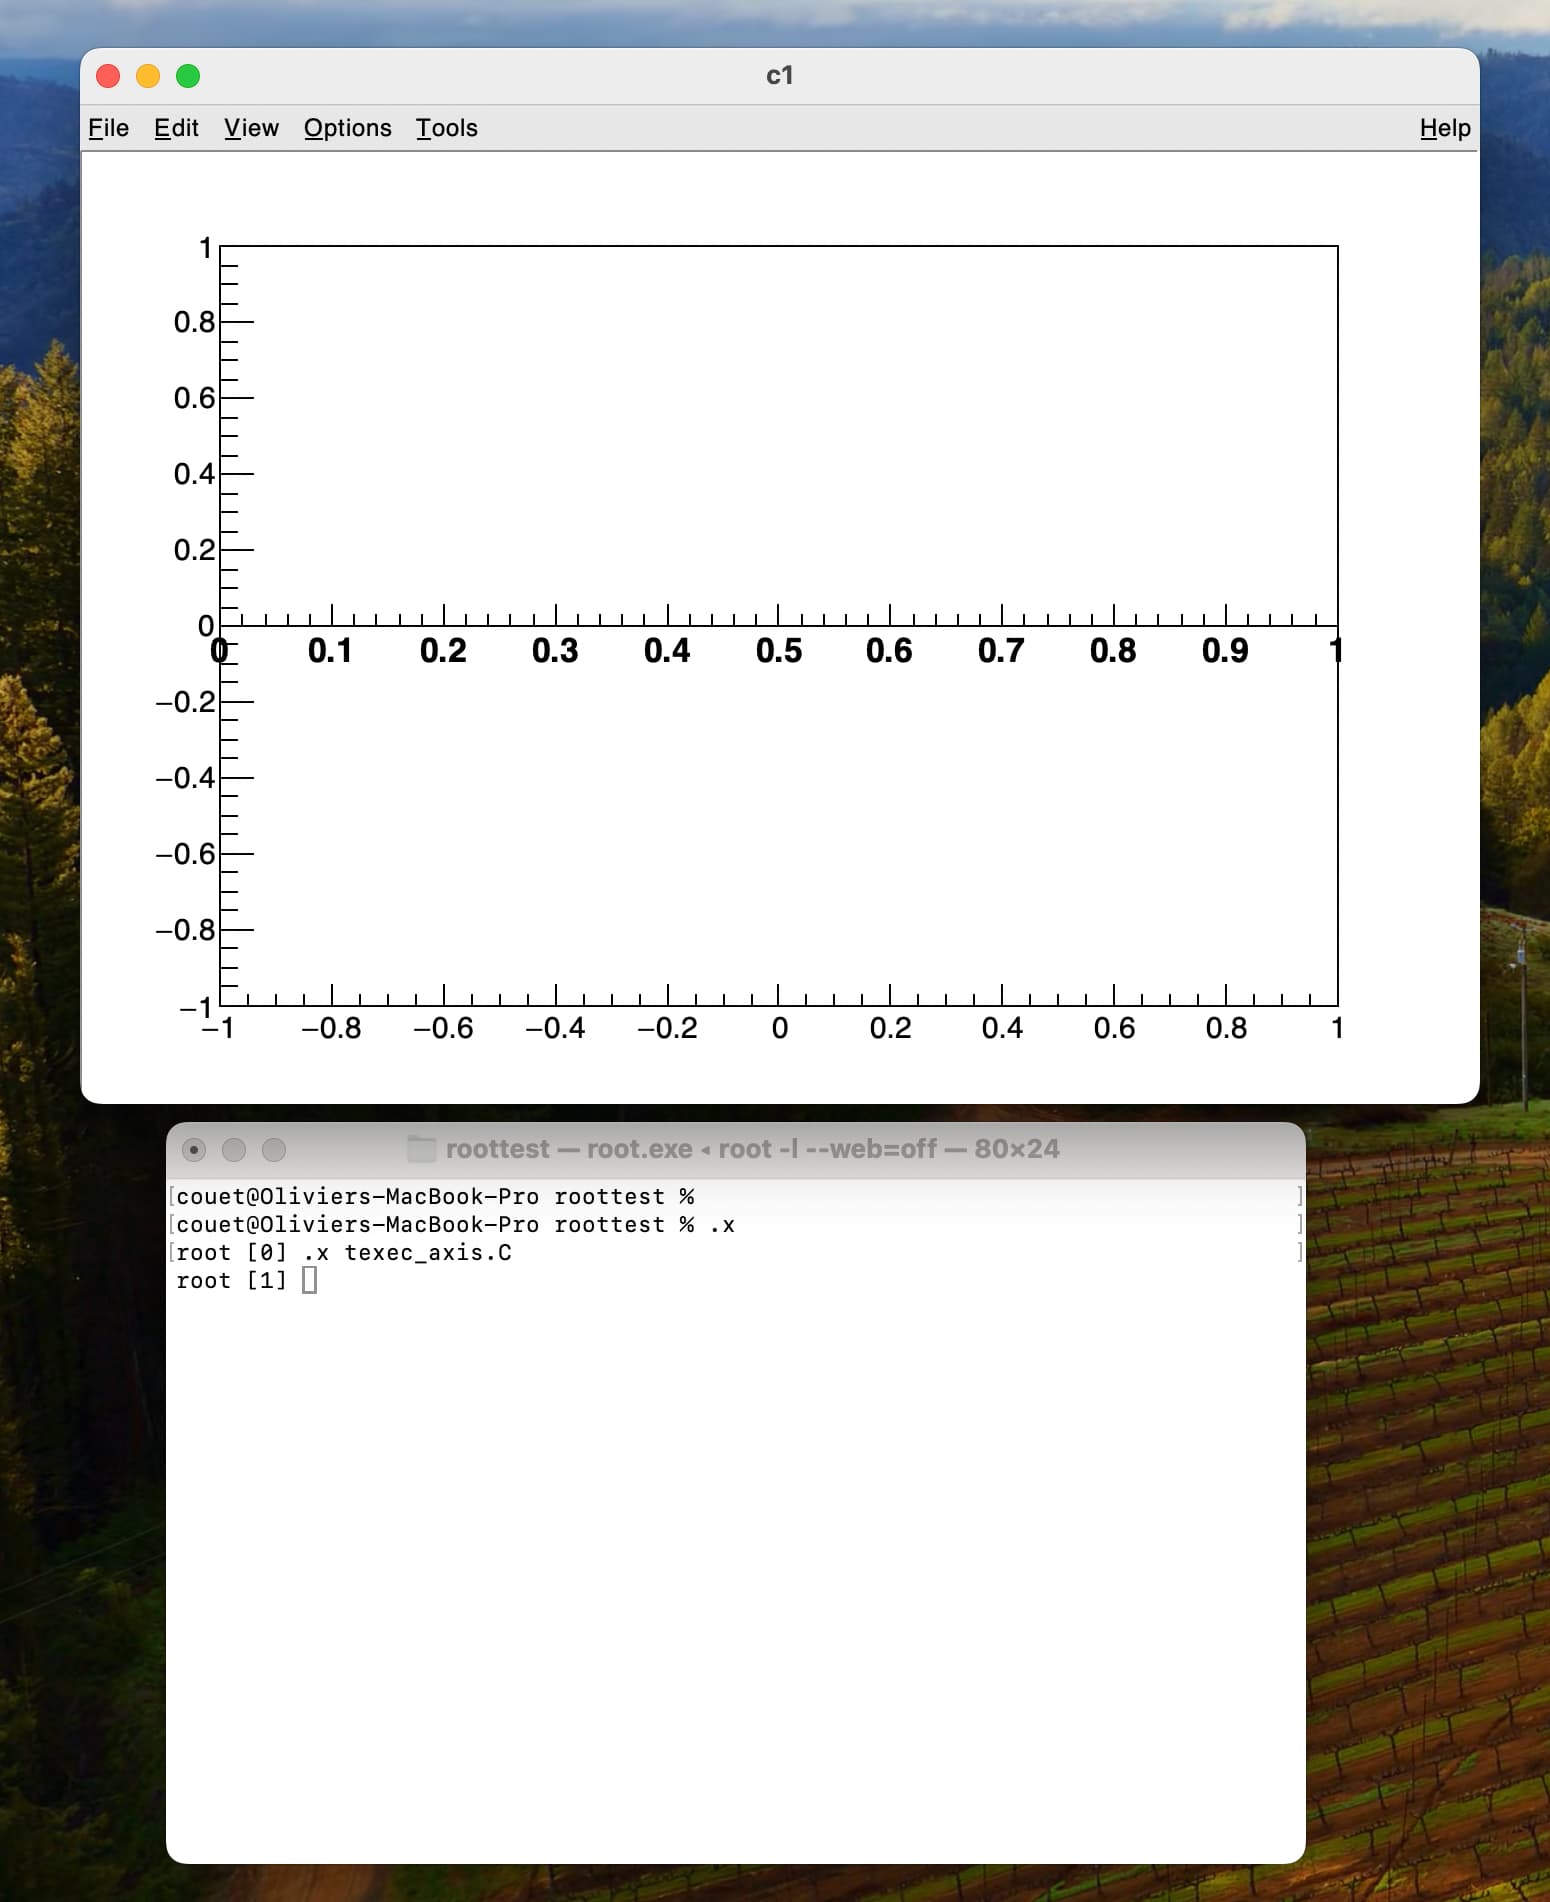
Yes, I can do it.
Is there another method to finish it but not via ROOT macro. For example ,use TApplication.
That way is the simplest I guess. An other way would be to add the TGaxis in the list of functions of the histogram. but that’s not simpler.
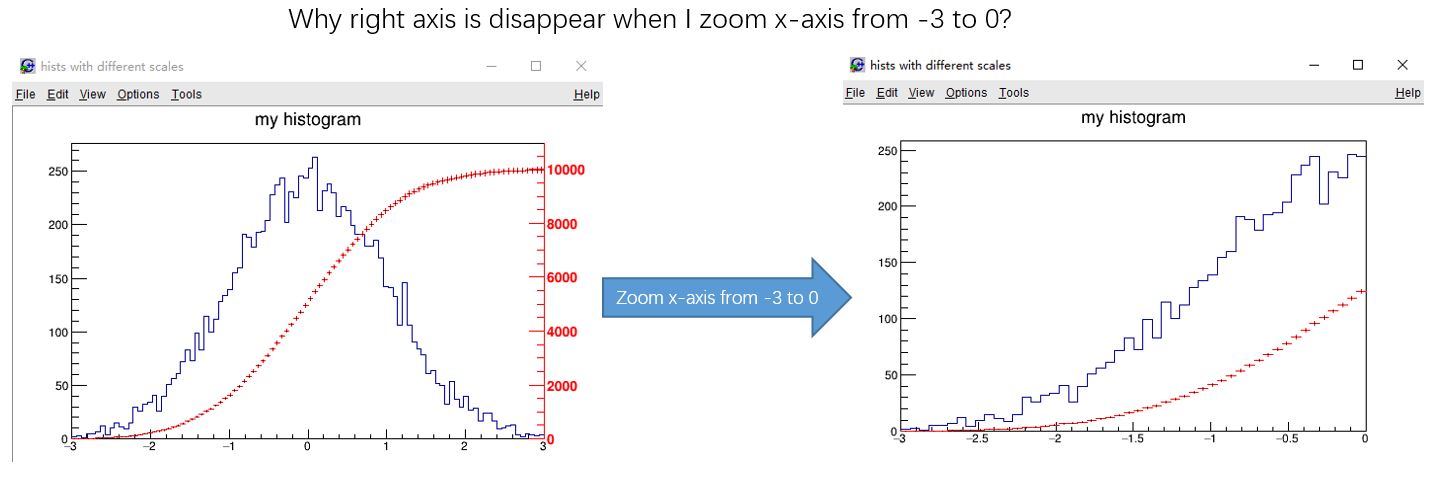
May be (not sure in your case), you can also use the option +Y.
“Y+” The Y-axis is drawn on the right side of the plot.