Hi,
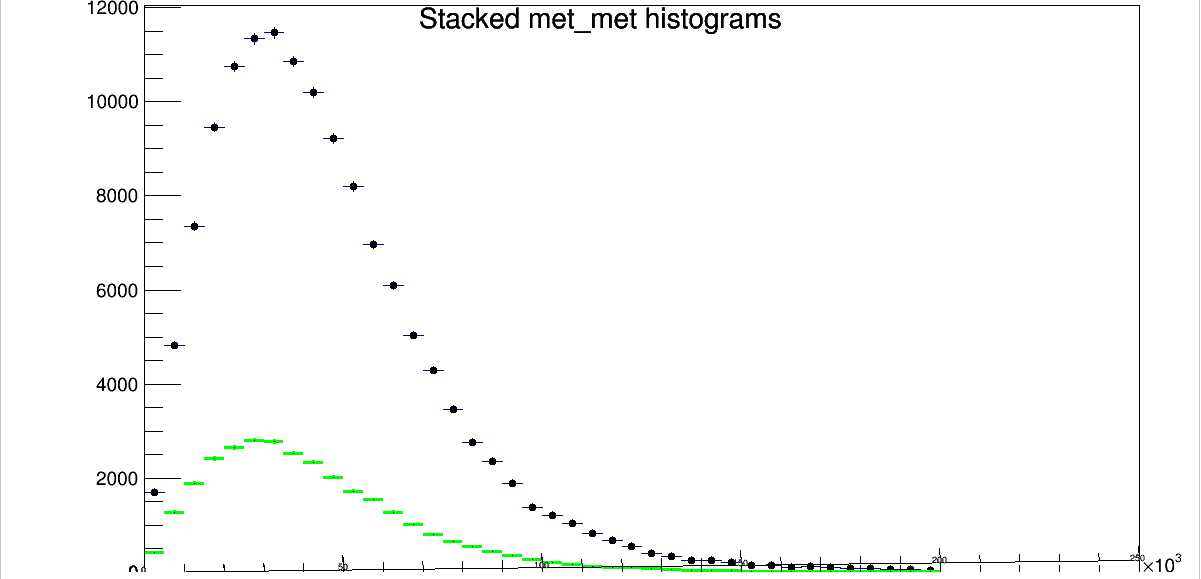
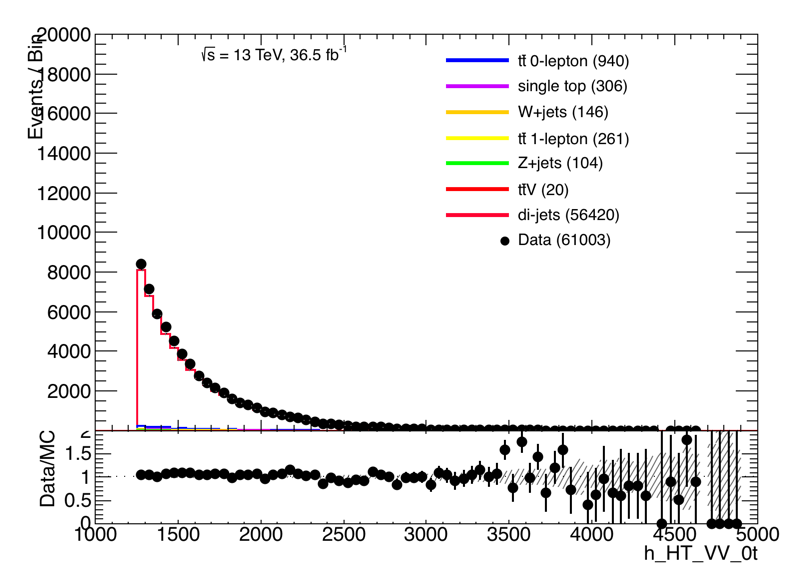
I want to convert a root histogram that I have to an array so that I can use the array to re-create the histogram using matplotlib with better aesthetics. I show bellow my code and even though it produces a histogram, it doesn’t look like the original histogram. Can any one please help me to figure what I’m doing wrong here? (I change the bins=10 from bins=binnxs because the code fails)
Thanks!!!
#!/usr/bin/env python

import ROOT as Root
import numpy as np
import matplotlib.pyplot as plt

fig = plt.figure()
h1 = fig.add_subplot(1,1,1)


loc = str("../V_tag_hists/VV_0t/CR_0bHHT/")
a = Root.TFile.Open(loc+"hists_data_lowMET.root")
b = Root.TFile.Open(loc+"hists_dijet_lowMET.root")

x = a.Get("HT")
y = b.Get("HT")

binnxs = [x.GetXaxis().GetBinLowEdge(1)]
bin_contenta = []
bin_contentb = []
print(binnxs)


for i in xrange(1,x.GetNbinsX()+1):
    bin_contenta.append(x.GetBinContent(i))
    binnxs.append(x.GetXaxis().GetBinUpEdge(i))
for j in xrange(1,y.GetNbinsX()+1):
    bin_contentb.append(y.GetBinContent(j))


h1.hist([bin_contenta,bin_contentb], bins=10, histtype='step', stacked = True)

plt.tight_layout()
plt.show()
plt.savefig('new.png',facecolor=fig.get_facecolor(),
            edgecolor=fig.get_edgecolor())