I am havinig troubles with the calculation of the statistical significance of a measurement including systematic uncertainties.
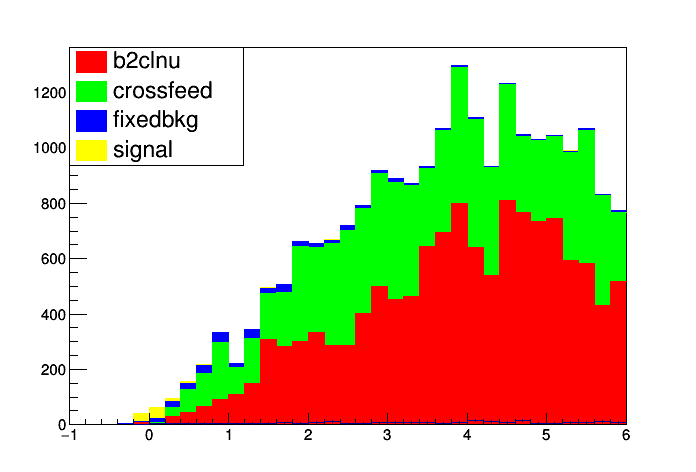
For the model I considered four histogram templates, one for the signal and three for background processes. One of the background processes is fixed in the fit to the MC prediction. I also generated histograms to evaluate systematics due to the shape of the background. All the histograms are scaled according to the luminosity.
In a first attempt, I calculated the significance without systematics using two approaches with the asymptotic calculator:
The histogram templates for the MC (signal and 3 backgrounds) are scaled according to the luminosity. In this case the significance is calculated to be zero.
The histogram templates for MC are normalized to 1. The significance is calculated to be 2.89.
When I try to include systematics, the result the significance is nan for both cases. I would like to know what I am doing wrong. How can I treat the histograms that include a shape systematics in the generation of the workspace.
I also used the frequentists calculator with the 2-sided Profile Likelihood method and only works for the case when all histograms are normalized to 1 and without systematics.
I can’t see anything apriori wrong with what you’re doing but it’s difficult to tell without looking at the workspace itself (or better yet the input file containing all the histograms) feel free to email me a swan/cernbox link and I’ll have a look.
The only suggestion that I have in the short term is that when workspace building on line 166 you make a single channel model rather than a combined model. h2w.MakeSingleChannelModel(meas, chan) as described briefly here http://vincentcroft.web.cern.ch/vincentcroft/KaggleFit-Histfactory.html
were in the process of updating all the HistFactory and RooFit documentation so please get in touch if this doesn’t help.
thank you very much for your reply. The file containing the nominal histograms and those with systematic variations, scaled according to the luminosity (the ones I used for the fit), are found in significance_with_systematics_oneD_bin1_scaled2Lumi.root (373.8 KB)
However, when I try to create the workspace and look at the distribution for the profile likelihood, those do not help, I have to normalize the histograms to 1 to get the plot for the profile likelihood and compute also the significance. The following file contains the histograms I used to create the workspace: significance_with_systematics_oneD_bin1_SR.root (337.8 KB)
Another question I have is how to calculate the combined significance from more than two measurements. In this case I have a measurement in a mass region (bin1), but there are more regions. I was told to calculate the log-likelihood of signal+background Lsb, and background only Lb and calculate the significance with systematics as sqrt(-2Lsb/Lb), and to combine them as sqrt(-2 Sum Lsb /Sum Lb), but the method in the code only calculate the significance significance and does not give the values for Lsb, and Lb.
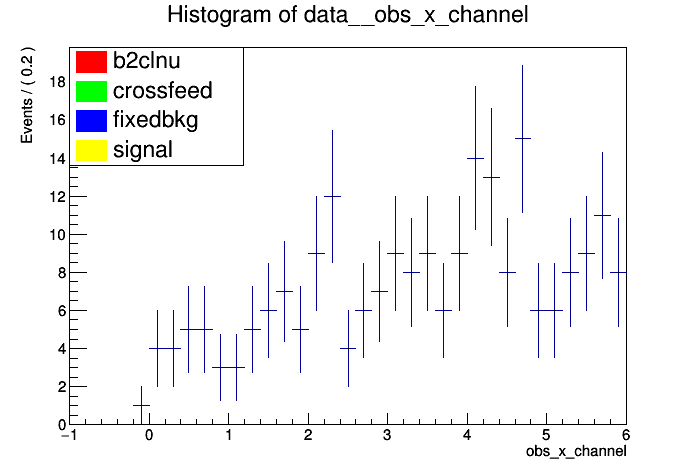
…jup that’s the data right down on the bottom of the plot!..
In histfactory, as opposed to other hep fits, we use histogram templates and the parameters of the model are always calculated with respect to the expected number of events. You expect a hundred thousand and you see about a hundred! Your parameter of interest is not the number of signal events it’s the normalisation on the number of signal events with respect to that given in the model. Hence in the first case you get zero significance since all of your templates are basically scaled to zero. When you allow the model a little more wiggle room in the case of adding systematics they all try their best to pull the model down the ~300% needed to match that data and therefore all fall out of range. Hence the nans.
Simply scaling the data to the expected number of events (before making the workspace) as you have with the MC templates or fitting to the dataset called ‘asimovData’ should fix all your problems!
thank you for your reply.
I still do not understand where the problem is. In the creation of the histograms I used two options, first the MC histograms are scaled to the fit values, and second the MC histograms are scaled to 1. But you mentioned that I have to also scaled the data histograms, what would be the scaling factor for each case?
Then I move to the creation of the workspace, in this page https://twiki.cern.ch/twiki/bin/view/RooStats/HistFactoryXMLReference there is a suggestion on what to do with some parameters, in my case lumi=1.
For my first case, NormFactor are values close to one.
For my second case, NormFactor are values around the measured events in data.
I tried both, also scaling the data to the total MC, but still I am geting nan values for the significance. Should the problem be in the code for the creation of the workspace?
Hi cesar, I’m afraid that all I know is that you’re trying to stretch 100 data points to fit a statistical model 100000 events wide. Your obsData and MC simply don’t fit together.
If you want to continue and already start looking at fancier things like the the asymptotic calculator you can just change L69 in the StandardHypoTestDemo.C to read ‘asimovData’ and that’ll get you going.