Hello,
I am using root to plot a 2D significance plot of two histograms I have. These are the two histograms I am inspecting:
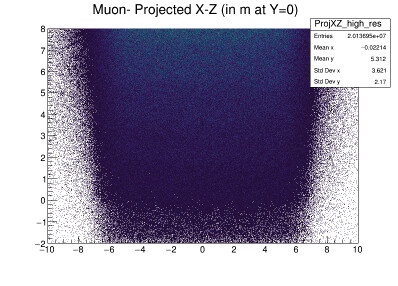
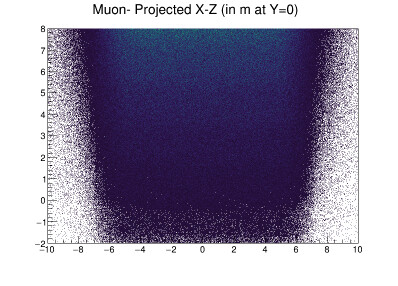
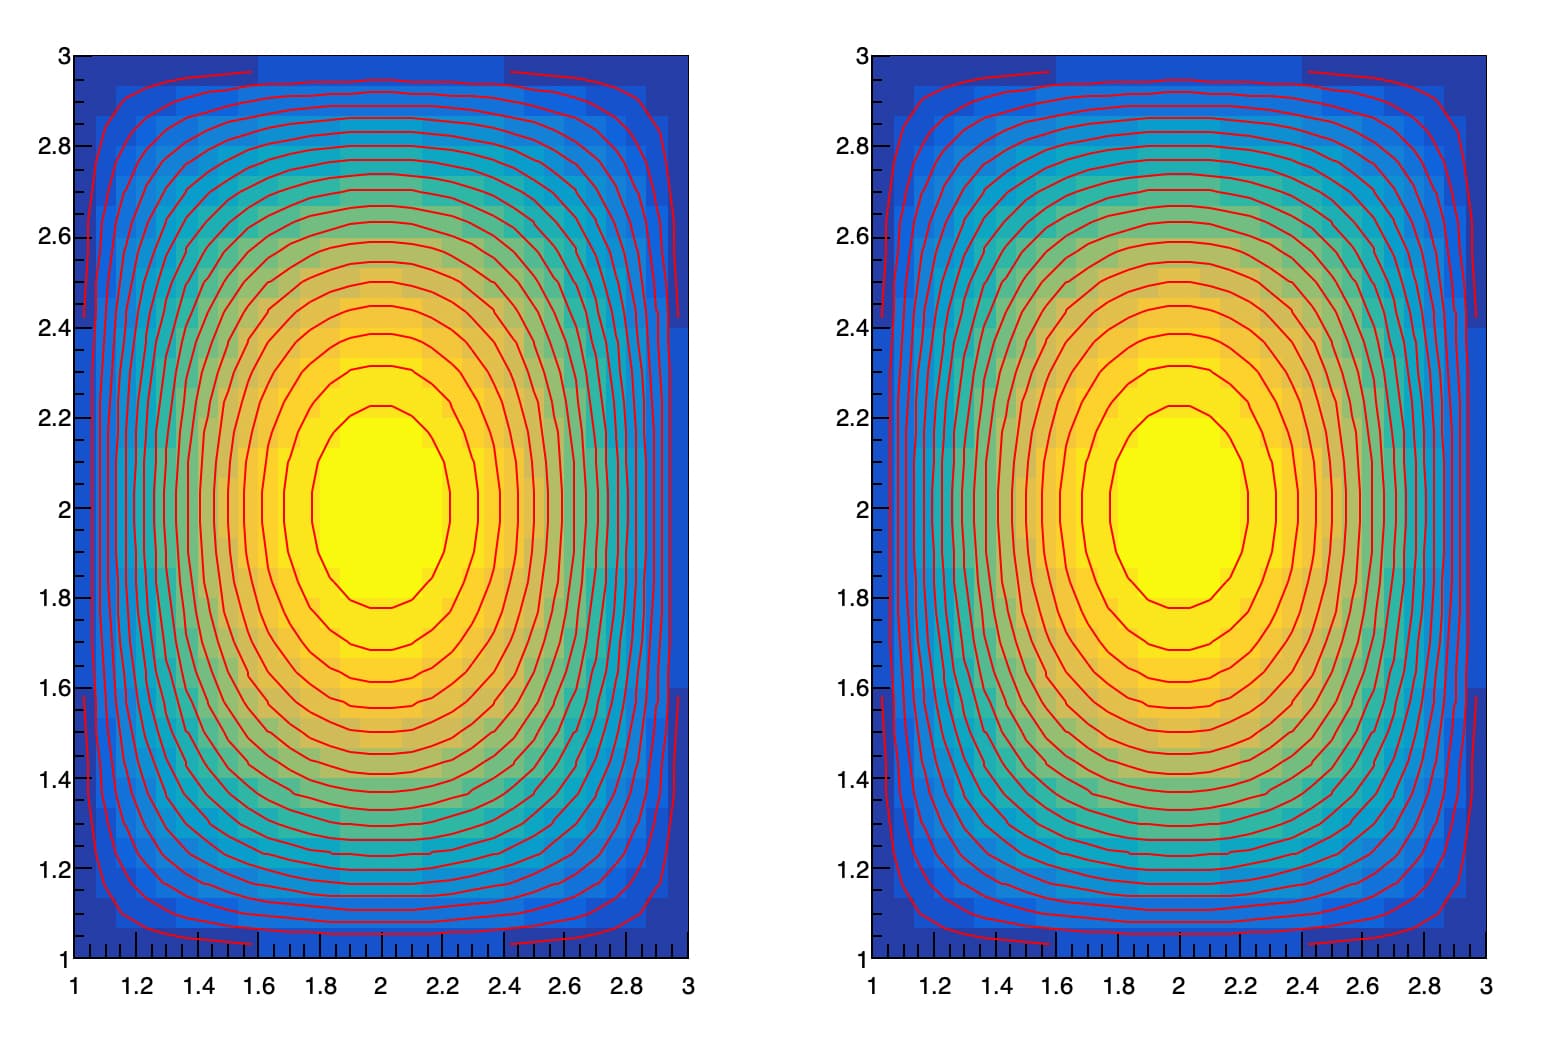
They look the same, but they are not. I have code that rebins these and then calculates the significance per bin and plots that. I then do this again, smearing the histogram data before rebinning. I am trying to plot both the smeared and unsmeared significance plots side by side and add contours to them. For the smeared version, contours works, but not for the unsmeared plot. Why? What is the issue here? It seems like it should do the contour plots for both. Here is the code and the plot it produces:
import ROOT
import numpy as np
import os
from random import gauss
from IPython.display import Image, display

# Define smearing parameters
error_x = 0.5
error_y = 0.5
rebin_x = 100
rebin_y = 100

# Load ROOT files
file1 = ROOT.TFile("rootfiles/C0RAA_120days_high_res.root")
file2 = ROOT.TFile("rootfiles/C0RRR_120days_high_res.root")

# Get histograms
hist1 = file1.Get("ProjXZ_high_res")
hist2 = file2.Get("ProjXZ_high_res")
if not hist1 or not hist2:
    raise RuntimeError("One or both histograms not found!")

# Get binning info
x_bins = hist1.GetXaxis().GetNbins()
y_bins = hist1.GetYaxis().GetNbins()
x_min = hist1.GetXaxis().GetXmin()
x_max = hist1.GetXaxis().GetXmax()
y_min = hist1.GetYaxis().GetXmin()
y_max = hist1.GetYaxis().GetXmax()

# Smear entries
smeared1 = ROOT.TH2F("smeared1", "Smeared C0RAA", x_bins, x_min, x_max, y_bins, y_min, y_max)
smeared2 = ROOT.TH2F("smeared2", "Smeared C0RRR", x_bins, x_min, x_max, y_bins, y_min, y_max)

for ix in range(1, x_bins + 1):
    for iy in range(1, y_bins + 1):
        count1 = int(hist1.GetBinContent(ix, iy))
        count2 = int(hist2.GetBinContent(ix, iy))
        x = hist1.GetXaxis().GetBinCenter(ix)
        y = hist1.GetYaxis().GetBinCenter(iy)
        for _ in range(count1):
            smeared1.Fill(gauss(x, error_x), gauss(y, error_y))
        for _ in range(count2):
            smeared2.Fill(gauss(x, error_x), gauss(y, error_y))

# Create unsmeared clones
rebinned1 = hist1.Clone("rebinned1")
rebinned2 = hist2.Clone("rebinned2")
rebinned1.RebinX(rebin_x)
rebinned1.RebinY(rebin_y)
rebinned2.RebinX(rebin_x)
rebinned2.RebinY(rebin_y)

# Create smeared rebinned
smeared_rebinned1 = smeared1.Clone("smeared_rebinned1")
smeared_rebinned2 = smeared2.Clone("smeared_rebinned2")
smeared_rebinned1.RebinX(rebin_x)
smeared_rebinned1.RebinY(rebin_y)
smeared_rebinned2.RebinX(rebin_x)
smeared_rebinned2.RebinY(rebin_y)

# Compute significance
def compute_significance(h1, h2, name):
    sig = h1.Clone(name)
    sig.Reset()
    for ix in range(1, h1.GetNbinsX() + 1):
        for iy in range(1, h1.GetNbinsY() + 1):
            raa = h1.GetBinContent(ix, iy)
            rrr = h2.GetBinContent(ix, iy)
            if rrr > 0 and raa > 0:
                r = raa / rrr
                r_err = r * np.sqrt(1 / raa + 1 / rrr)
                significance = np.abs((1 - r) / r_err) if r_err != 0 else 0
            else:
                significance = 0
            sig.SetBinContent(ix, iy, significance)
    return sig

significance_unsmeared = compute_significance(rebinned1, rebinned2, "significance_unsmeared")
significance_smeared = compute_significance(smeared_rebinned1, smeared_rebinned2, "significance_smeared")


# Plot side by side
ROOT.gStyle.SetOptStat(0)
ROOT.gStyle.SetPalette(ROOT.kViridis)

canvas = ROOT.TCanvas("c_both", "Significance Comparison", 1800, 700)
canvas.Divide(2, 1)

label_size = 0.045
title_size = 0.05


for idx, (hist, title) in enumerate([
    (significance_unsmeared, "Unsmeared Significance"),
    (significance_smeared, "Smeared Significance")
]):
    pad = canvas.cd(idx + 1)
    pad.SetRightMargin(0.15)
    hist.SetTitle(title)
    hist.GetXaxis().SetTitle("x [m]")
    hist.GetYaxis().SetTitle("z [m]")
    hist.GetZaxis().SetTitle("Significance")
    hist.GetXaxis().SetLabelSize(label_size)
    hist.GetYaxis().SetLabelSize(label_size)
    hist.GetZaxis().SetLabelSize(label_size)
    hist.GetXaxis().SetTitleSize(title_size)
    hist.GetYaxis().SetTitleSize(title_size)
    hist.GetZaxis().SetTitleSize(title_size)
    hist.SetMinimum(0)
    hist.SetMaximum(5)
    hist.GetXaxis().SetRangeUser(-6, 6)
    hist.GetYaxis().SetRangeUser(-1, 6)
    hist.Draw("COLZ")

    # Draw contour
    contour = hist.Clone(f"contour_{idx}")
    contour.SetContour(3)
    contour.SetContourLevel(0, 3)
    contour.SetContourLevel(1, 4)
    contour.SetContourLevel(2, 6)
    contour.SetLineColor(ROOT.kBlack)
    contour.SetLineWidth(2)
    contour.Draw("CONT3 SAME")


# Save and display
os.makedirs("plots", exist_ok=True)
outpath = "plots/significance_comparison.png"
canvas.SaveAs(outpath)
display(Image(outpath))

As you can see, the contour plots only work for the right plot. Thank you for your help!
ROOT Version: 6.30.04
Platform: MacOS arm64
Compiler: clang version 16.0.6