Hi,
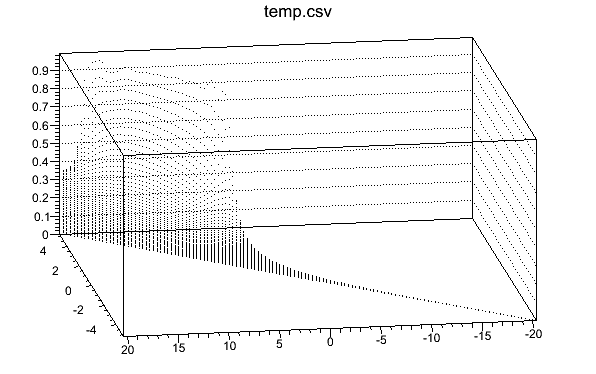
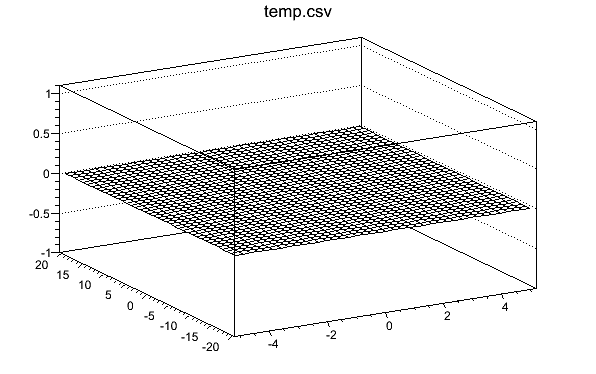
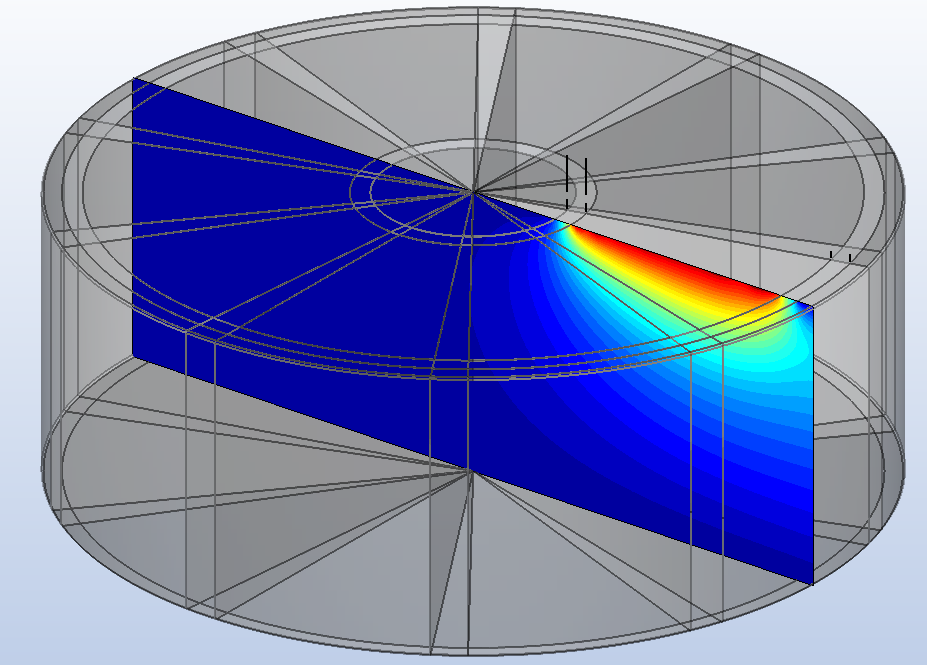
I’m interested in reproducing the attached plot (WP-trapezoid.png - generated with an E&M solver) using ROOT. The data (temp.csv) are a grid of 6000+ points (-5.5<x<5.5, -20<y<20) whose z values are bounded (0<z<1). I simply want to color code my grid and add contours (say green for 0.9 < z < 1., etc). This is not a histogram that I am creating so after studying the tutorials I attempted generating a scatter plot using TGraph2D, viz (omitting the contours for the time being)
#include <TRandom.h>
#include <TStyle.h>
#include <TCanvas.h>
#include <TF2.h>
void stevefit()
{
TCanvas *c1 = new TCanvas(“c1”,"",0,0,600,400);
TGraph2D *dt = new TGraph2D(“temp.csv”);
gStyle->SetPalette(1);
dt->Draw(“surf1”);
}
However, the result (results_with_ROOT.png) is always the same - the values for z are all identically zero. Obviously I am missing the boat here, perhaps by a long shot…
Thanks,
Steve
temp.csv (193 KB)