I am needing to make some contour plots and exploring the options available in ROOT. The data I am looking to plot is in YXZ format in the following file:
This an example, I need to make several plots and generally the data is pretty noisy. I am trying to make these plots using TGraph2D.
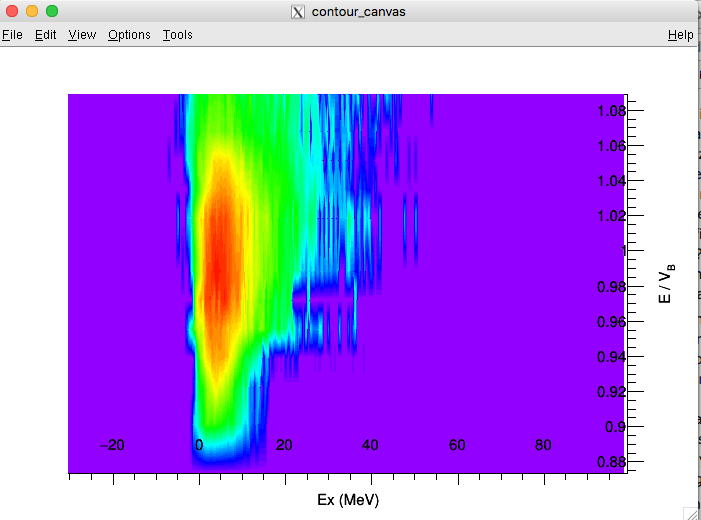
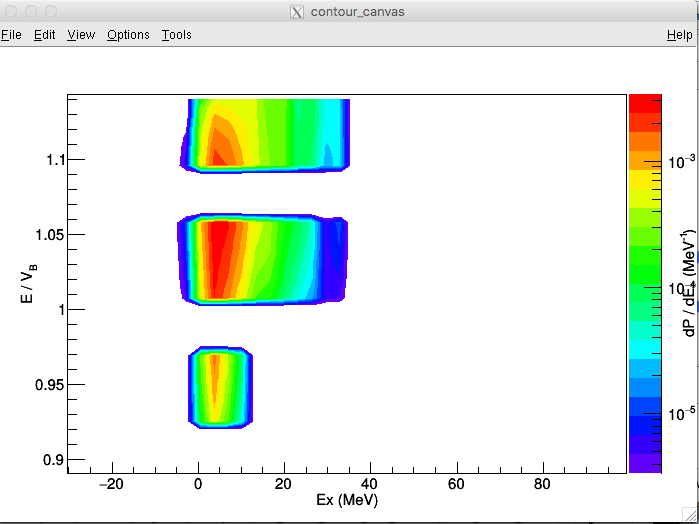
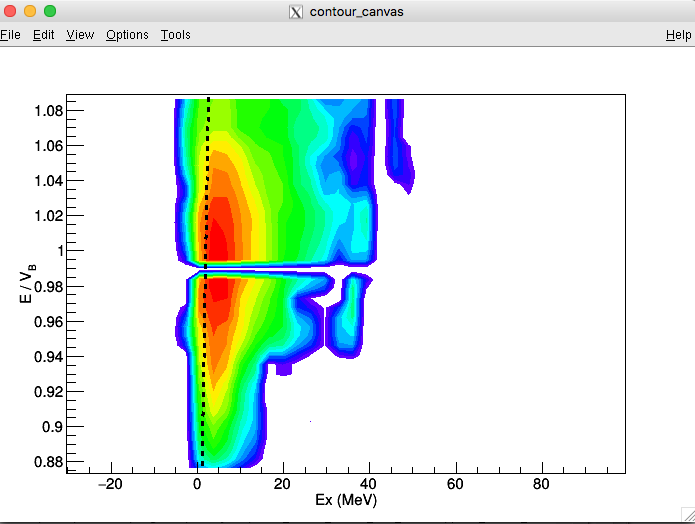
I like the look of the resulting figure when using the CONT4 option, as seen in the image below. However, for some reason I get a weird discontinuity in around Y = 0.99. This doesn’t seem to arise from the data so I am quite puzzled as to why this is appearing.
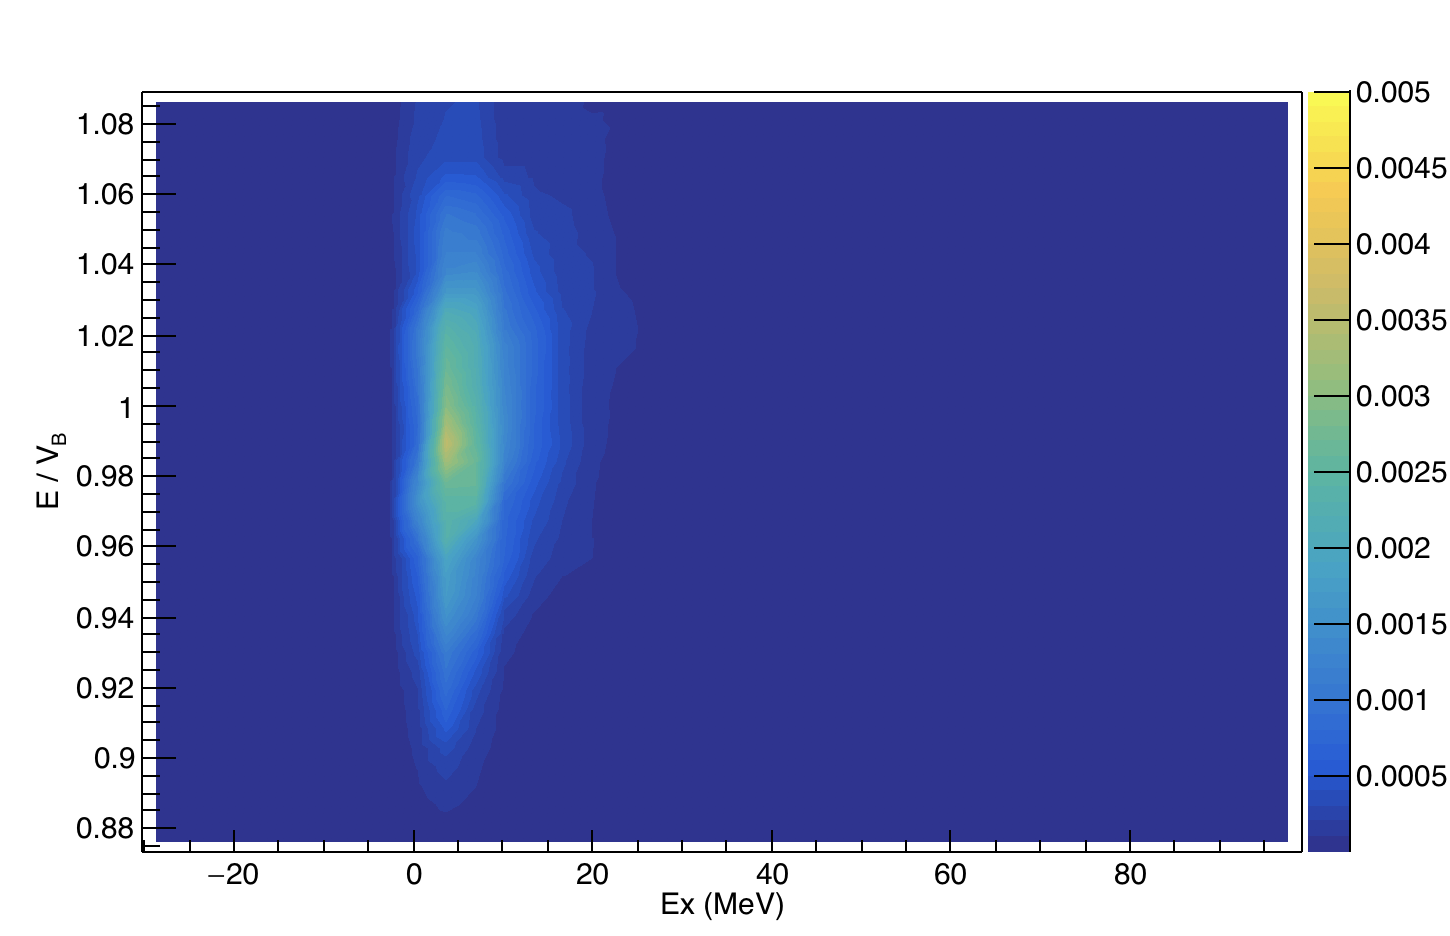
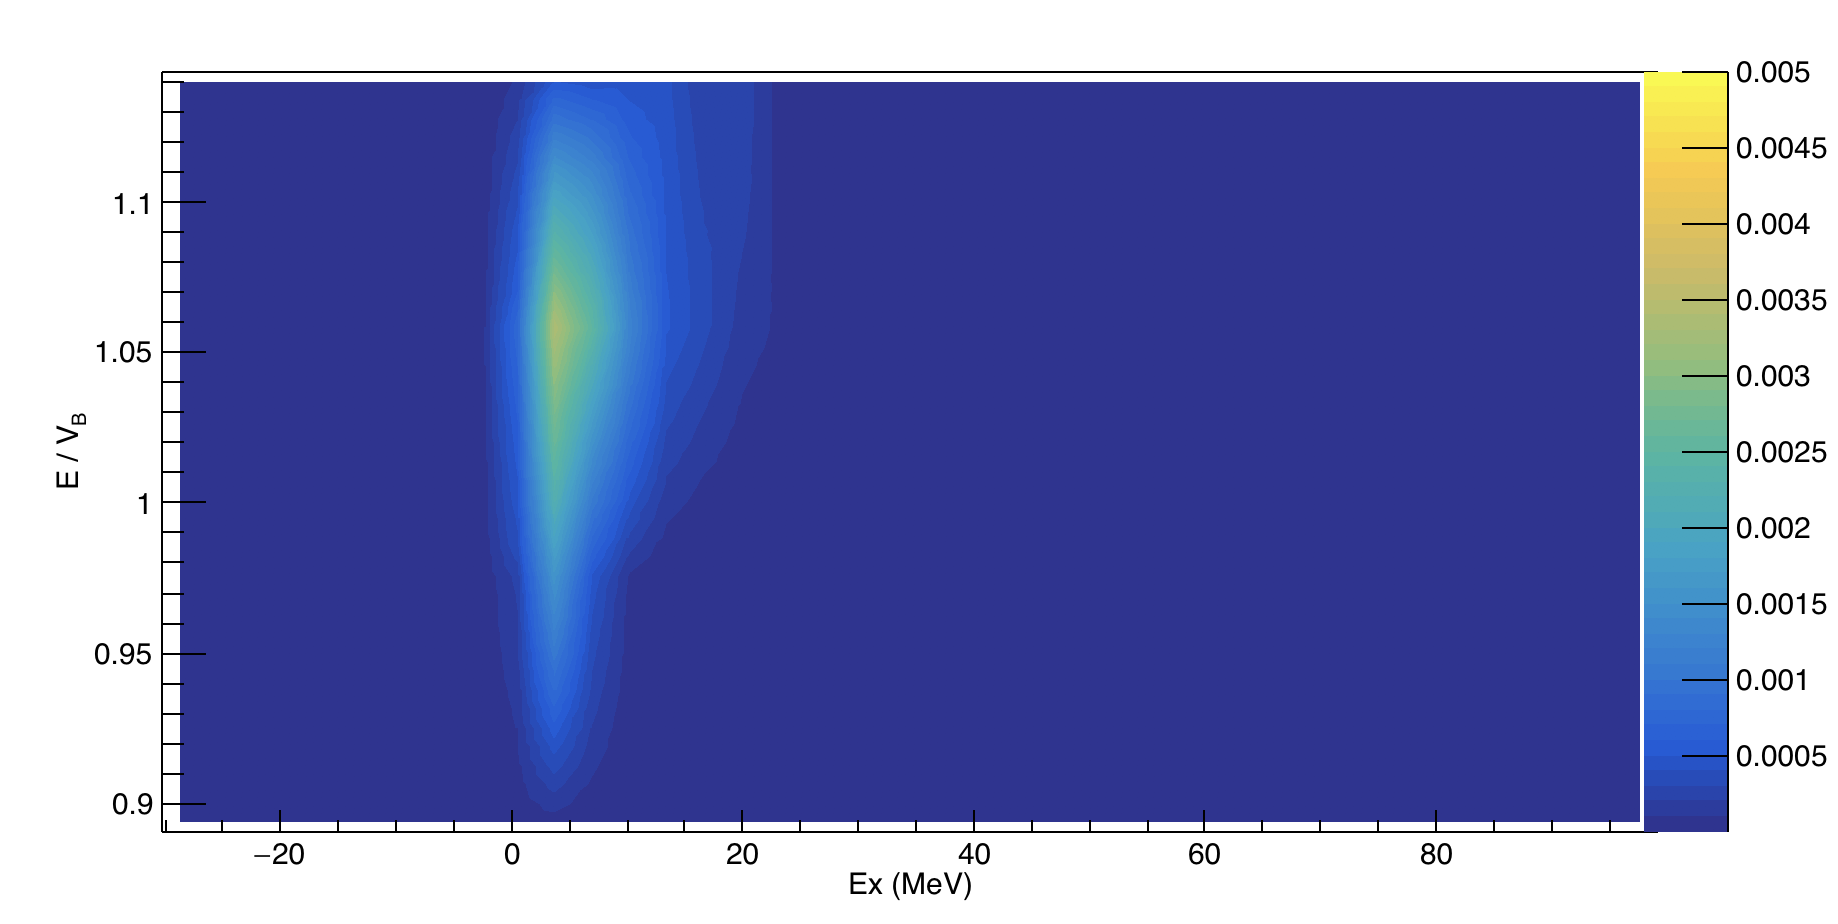
Alternatively I have tried the TRI2 option, which seems to smooth out this weird feature. However, I want to view the plot in the XY plane. To do this, I need to use:
canvas->SetTheta(90)
canvas->SetPhi(0)
To get the plot in the correct orientation. However, this seems to invert the X and Y axes This is shown below:
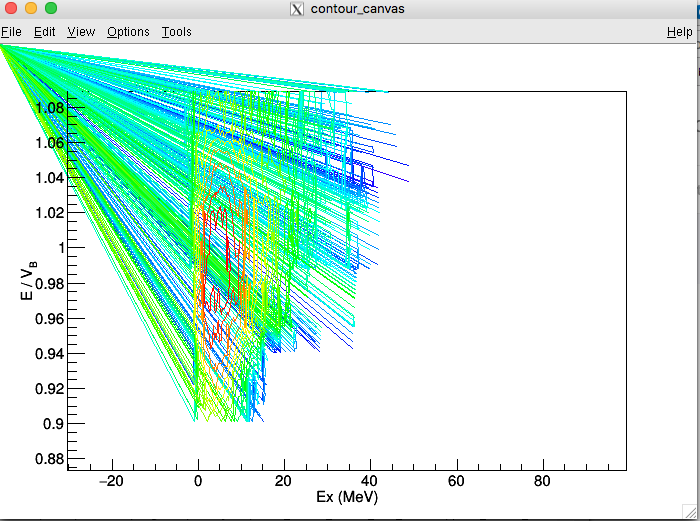
Does anyone have any suggestions to solve either of these problems? I have tried also the CONT5 option since this draws the contours using Delaunay triangulation, which I hoped would solve the problem of the discontinuity mentioned previously. However this creates an almighty mess, as shown below:
Any suggestions for making pretty contour plots from sporadic data will be welcomed. The data is continuous in the X-coordinate but sporadically sampled in Y, with the attached data file consisting of 12 different Y-values. I have other data sets that need to be plotted in such a fashion where there are only 4 Y-values, so the mentioned problems are even worse in these cases.
 This is shown below: